Next Section | Table of Contents
doi:10.2204/iodp.pr.301.2004
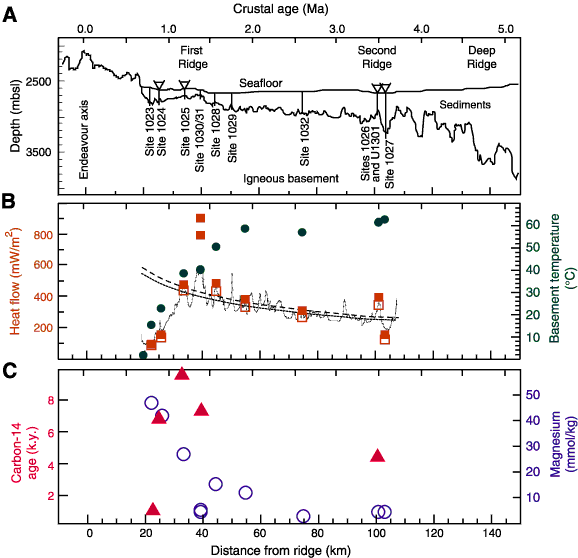
Figure F2. Summary of selected results from ODP Leg 168 and related experiments. A. Interpreted composite cross section from the active spreading center to the west, across the Leg 168 drilling transect, and continuing to the east. Vertical lines show locations of Leg 168 boreholes. Triangles at seafloor show locations of reentry cones and CORK observatories installed during Leg 168. CORK systems in Holes 1026B and 1027C were replaced during Expedition 301, and new CORKs were emplaced in Holes U1301A and U1301B, along the same buried basement ridge as Site 1026. B. Summary of thermal data. Solid circles are upper basement temperatures, based on in situ measurements and (in some cases) short extrapolations to basement depths. Open squares are heat flow values determined with Leg 168 temperature and thermal conductivity data, after applying temperature corrections and accounting for thermal conductivity anisotropy (Pribnow et al., 2000). Solid squares show the same values after correction for the effects of rapid sedimentation (Davis et al., 1999). Data from Sites 1030 and 1031 were not sediment-corrected because sediment cover is very thin and because the calculated correction is based on a one-dimensional approximation that is not valid where there are large variations in basement relief below thin sediments. The thin jagged line shows estimated heat flow values across the Leg 168 transect based on seismic and drilling data (Davis et al., 1999), after applying a sedimentation correction. The smooth dotted and dashed curves show lithospheric reference models by Parsons and Sclater (1977) and Stein and Stein (1994), respectively. C. Chemistry of basement fluids, as determined from extrapolation of basal pore fluid gradients to the basement depths and (in the case of Hole 1026B) from direct sampling of formation fluids. Magnesium data show fluid alteration largely as a function of reaction temperature (Davis, Fisher, Firth, et al., 1997; Wheat and Mottl, 1994). 14C data show a consistent progression in apparent age from west to east at the western end of the transect, but samples from Sites 1031 and 1026 are considerably younger than waters to the west (Elderfield et al., 1999).