Next Section | Table of Contents
doi:10.2204/iodp.pr.301.2004
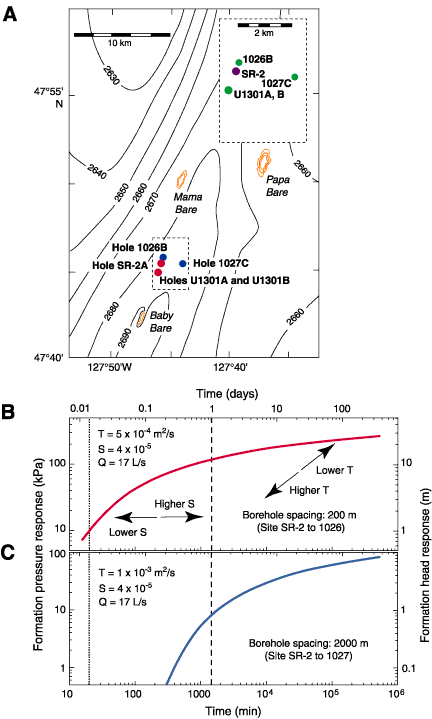
Figure F6. Crustal-scale hydrogeologic testing associated with IODP Expedition 301 and related experiments. A. Map view indicating spatial relations between CORK observatories (colored circles) in Holes 1026B, 1027C, U1301A, U1301B, planned Site SR-2, and nearby basement outcrops (gold bathymetric contours). Inset shows relative locations of pumping (P) and observation (O) wells for cross-hole experiments. Depth contours in meters. S = storativity, T = transmissivity. B. Calculated cross-hole responses to pumping and free-flow borehole experiments between wells at Sites SR-2 and 1026, separated by 200 m. C. Calculated cross-hole responses to pumping and free-flow borehole experiments between wells at Sites SR-2 and 1027, separated by 2200 m. Sites SR-2 and U1301 are 800 m apart, so the anticipated response is intermediate between the examples shown. Assumed formation properties are based on previously completed packer, free-flow, and CORK experiments. Differences in formation-scale values of T and S relative to those used would shift the curves as indicated by the arrows in A. Pumping tests in DSDP and ODP were typically only 20 min long (dotted vertical line); Expedition 301 tests were as long as 2 h. Future tests will begin with 24 h of pumping (dashed vertical line), and ultimately will last 1–2 y or more through venting of overpressured holes and pumping at the seafloor.