Next Section | Table of Contents
doi:10.2204/iodp.pr.302.2005
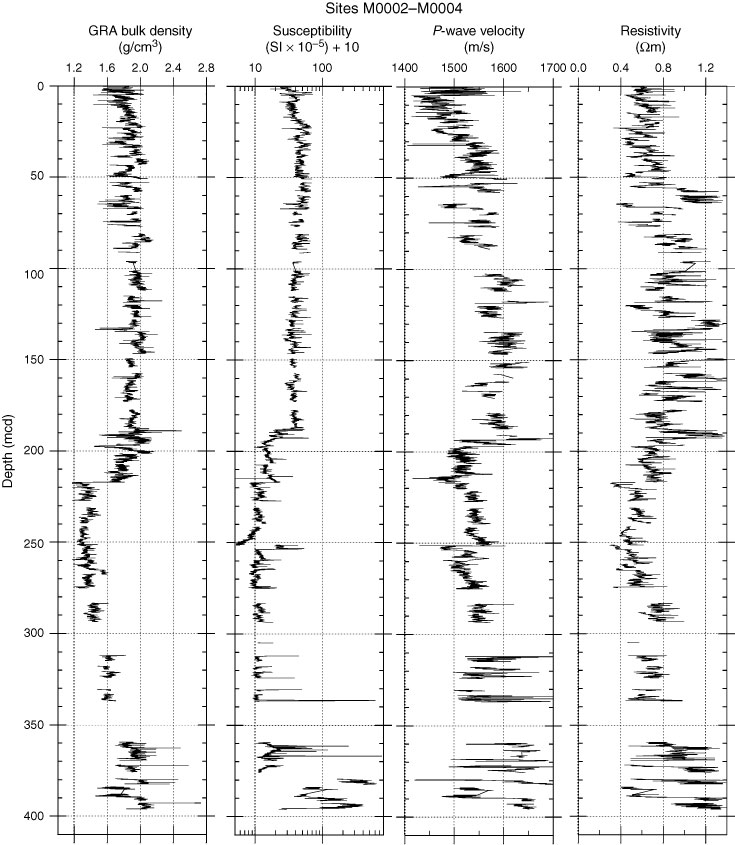
Figure F6. Multi Sensor Core Logger data plotted on a meters composite depth (mcd) scale and spliced together across all sites. GRA = gamma ray attenuation, NGR = natural gamma radiation. cps = counts per second. (Continued on next page.)