Next Section | Table of Contents
doi:10.2204/iodp.pr.309.2005
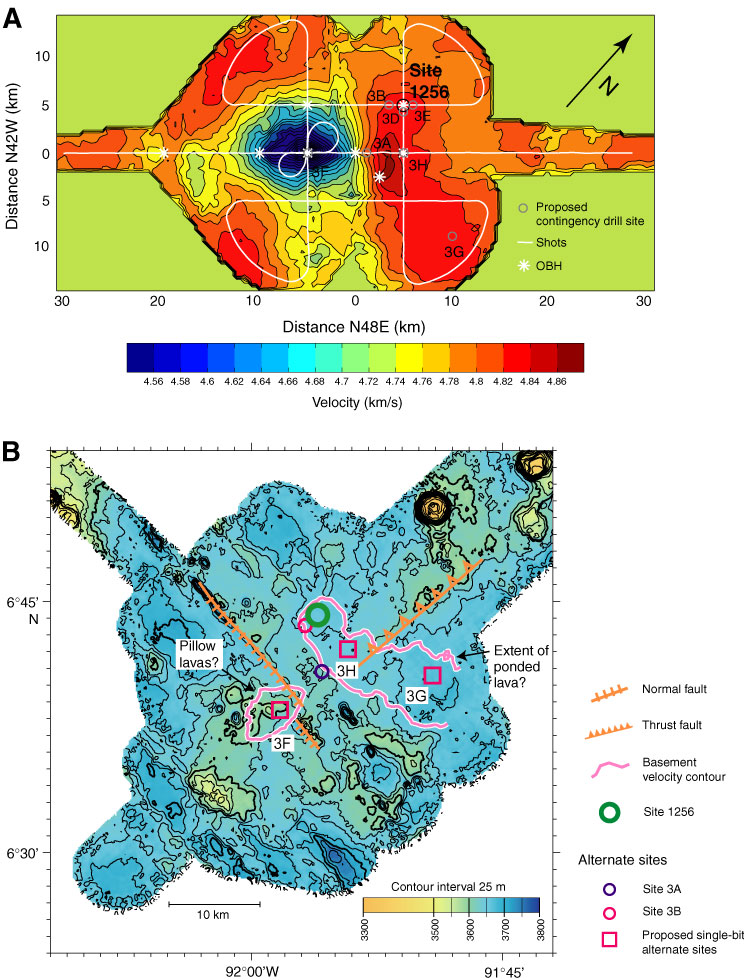
Figure F8. A. Contour map of seismic P-wave velocity at the top of basement, based on tomographic inversion of seismic refraction data (A. Harding, unpubl. data). The low-velocity area southwest of the center may reflect pillow lavas or other porous formation. The high-velocity area extending southeast from Site 1256 may reflect the extent of the ponded lava sequence drilled at the top of basement in Holes 1256C and 1256D. B. Geological map of Site 1256 area (GUATB-03) showing bathymetry, alternate site locations, and selected top-of-basement velocity contours from A. The larger velocity contour line partially encloses velocity >4.82 km/s, which we interpret as a plausible proxy for the presence of thick ponded lava flows, as encountered at Site 1256. The smaller contour encloses velocities <4.60 km/s, possibly reflecting a greater portion of pillow lavas than elsewhere in the region. Alternate reentry Sites 3D and 3E are 0.5–1.0 km from Site 1256.