Next Section | Table of Contents
doi:10.2204/iodp.pr.310.2006
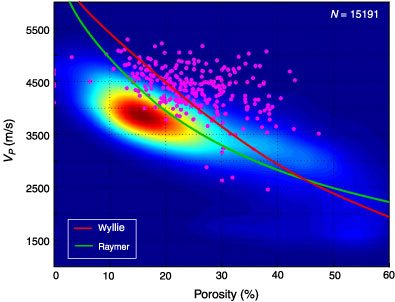
Figure F12. Cross plot showing all physical property data in the porosity and P-wave velocity domain. Instead of showing individual data points for the bulky MSCL data (15,191 data points), data density was contoured by moving a bin size of 0.200 km/s by 0.02 porosity units diagonally with increments of 1/30 of one bin size. Data density increases from blue to red. Purple = discrete sample properties (N = 355). In addition, commonly used velocity transforms, like those by Raymer (1980) and Wyllie (1956), are superimposed.