Next Section | Table of Contents
doi:10.2204/iodp.pr.311.2005
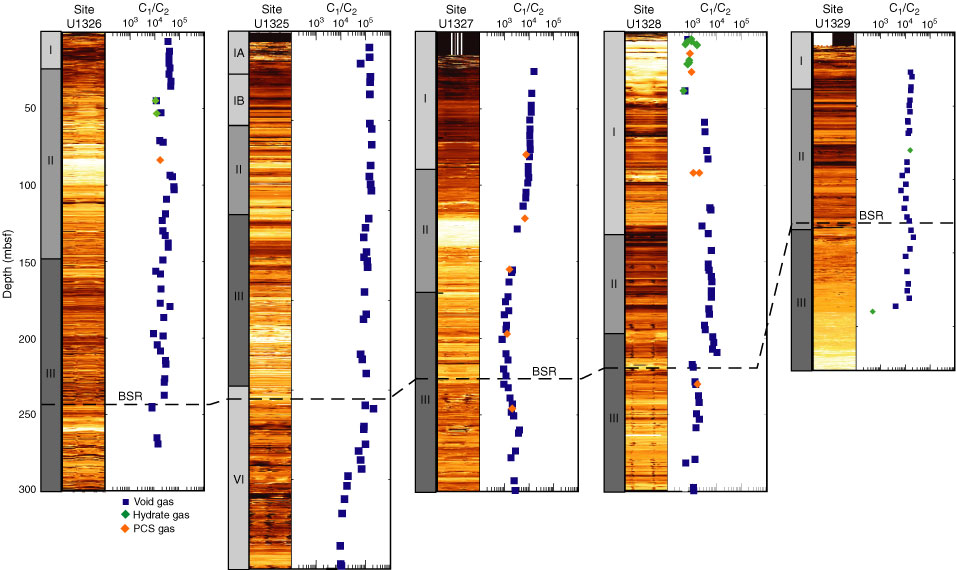
Figure F29. Summary of Expedition 311 C1/C2 gas profiles, including data from void, gas hydrate, and pressure core sampler (PCS) gas. Also shown are lithostratigraphic units and LWD RAB resistivity images and location of the bottom-simulating reflector (BSR).