Next Section | Table of Contents
doi:10.2204/iodp.pr.312.2006
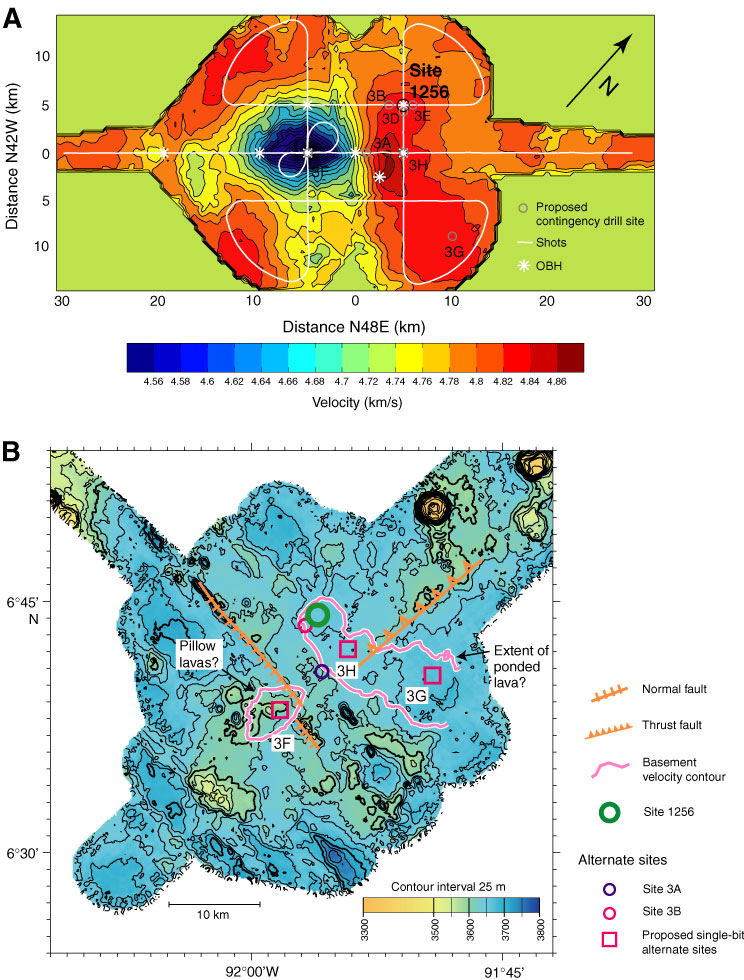
Figure F8. A. Contour map of seismic P-wave velocity at the top of basement, based on tomographic inversion of seismic refraction data (A. Harding, unpubl. data). The low-velocity area southwest of the center may reflect pillow lavas or other porous formation. The high-velocity area extending southeast from Site 1256 may reflect the extent of the ponded lava sequence drilled at the top of basement in Holes 1256C and 1256D. OBH = ocean bottom hydrophone. B. Geological map of Site 1256 area (GUATB-03) showing bathymetry, alternate site locations, and selected top-of-basement velocity contours from A. The larger velocity contour line partially encloses velocity >4.82 km/s, which we interpret as a plausible proxy for the presence of thick ponded lava flows, as encountered at Site 1256. The smaller contour encloses velocities <4.60 km/s, possibly reflecting a greater portion of pillow lavas than elsewhere in the region. Alternate reentry Sites 3D and 3E are 0.5–1.0 km from Site 1256.