Next Section | Table of Contents
doi:10.2204/iodp.pr.312.2006
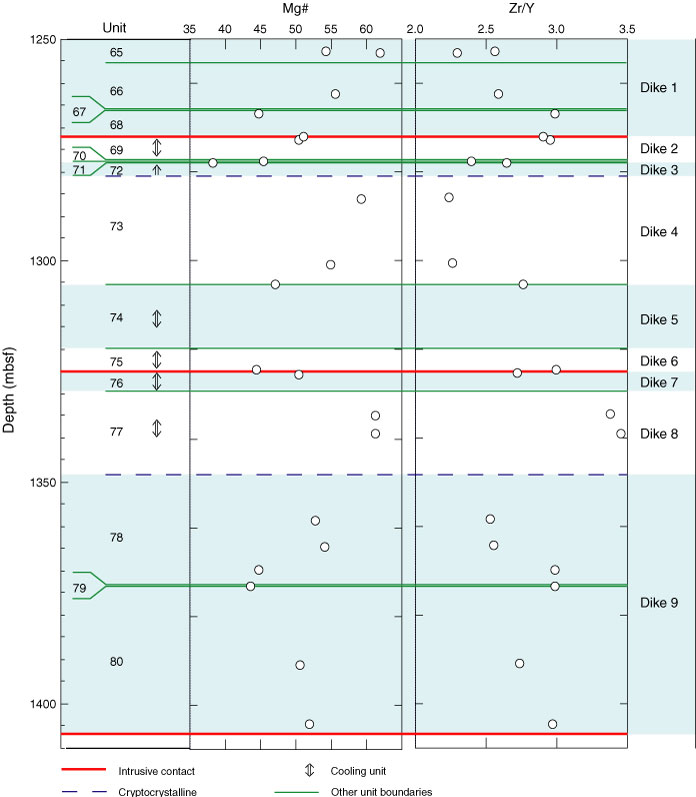
Figure F26. Downhole plot showing the relationship between units (first column), dike subdivisions inferred from lithologic observations, and key geochemical parameters. Where units are thin (Units 1256D-67, 70, 71, and 79) the bounding lines have been separated at the left of the column in order to provide clear labels of the units. Cooling units are defined by variations in grain size, from finer at the dike margins to coarser at their centers. Horizontal lines indicate the nature of the unit boundaries, either as recovered intrusive contacts, boundaries defined on the basis of the presence of cryptocrystalline material, or unit boundaries assigned using other criteria. Putative individual dikes, whose extent is determined by matching the observed contact types and cooling units with the minimum number of nonrepeating intrusions (see text) are alternately shaded light blue and white. 