Next Section | Table of Contents
doi:10.2204/iodp.pr.312.2006
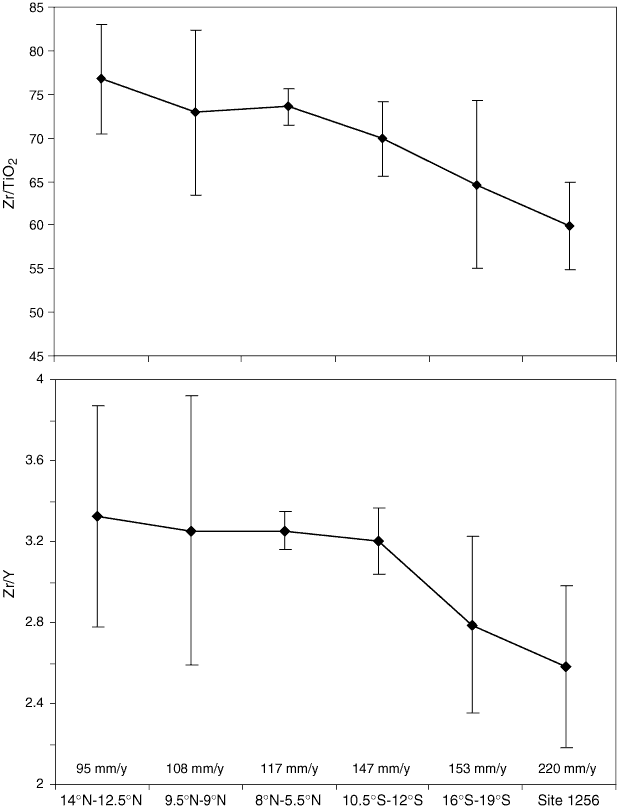
Figure F40. Zr/TiO2 and Zr/Y ratios for first order mid-ocean-ridge segments along the EPR from 14°N to 19°S and ODP/IODP Site 1256 (Leg 206 and Expeditions 309 and 312). Zr and Y data are taken from PETDB (www.petdb.org) and the plotted values are the average of segment centers; error bars = 1 . The spreading rate of each segment is calculated by the Online Ridge Spreading rate calculator (www.ldeo.columbia.edu/users/menke/plates.html). The spreading rate of Site 1256 is given by Wilson (1996). The range of latitude of each segment center is indicated by the labels underneath the x-axis, and numbers above the x-axis are the spreading rate (full rate) of each segment.