Next Section | Table of Contents
doi:10.2204/iodp.pr.312.2006
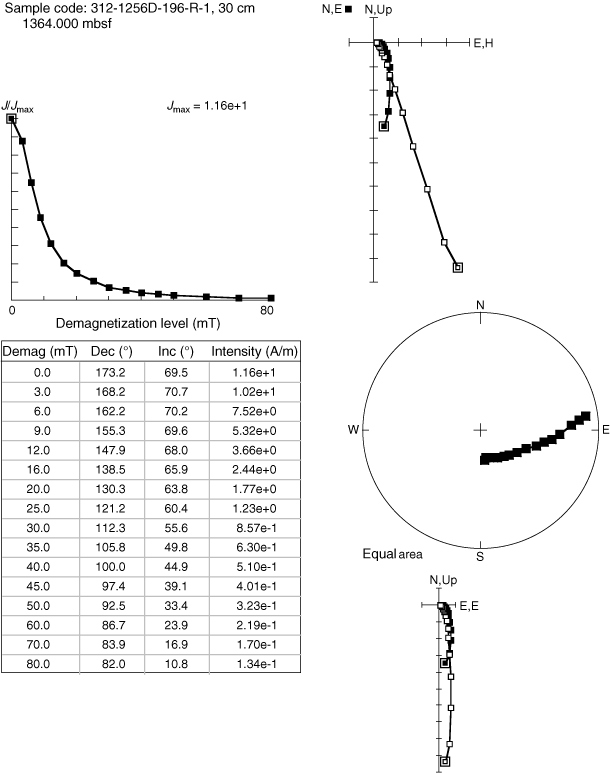
Figure F56. AF demagnetization behavior of a sample typical of the depth interval from 1256 to 1400 mbsf (discrete Sample 312-1256D-196R-1, 30–32 cm). Normalized intensity versus demagnetization level is at upper left; component diagrams and direction plots are on the right. Directions show a smooth progression toward shallow inclinations but without a clear end point.
