Next Section | Table of Contents
doi:10.2204/iodp.pr.312.2006
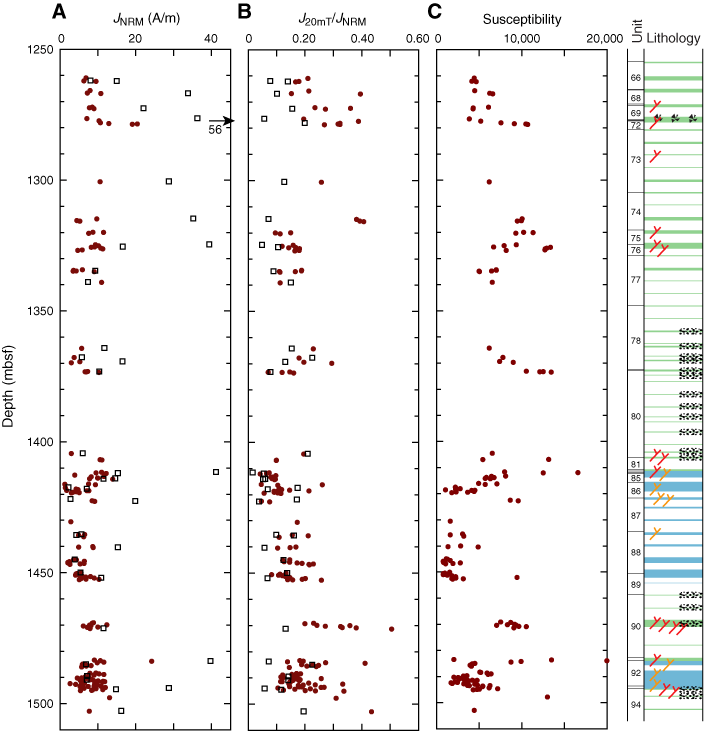
Figure F59. Downcore variations in (A) natural remanent magnetization (NRM) intensity, (B) ratio of intensity after 20 mT demagnetization to NRM intensity, and (C) magnetic susceptibility.
