Next Section | Table of Contents
doi:10.2204/iodp.pr.312.2006
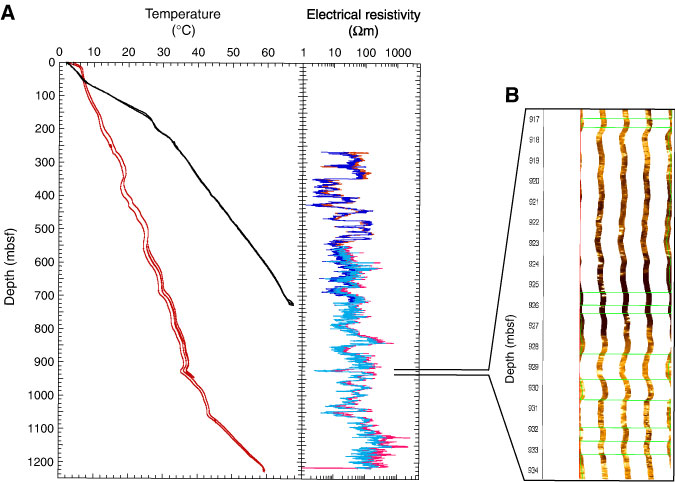
Figure F63. A. Temperature profiles of Hole 1256D measured with the TAP tool before the commencement of drilling operations (black curve) and after completion of drilling (red curve) and electrical resistivity measured with the Dual LateroLog. B. FMS data illustrating the correspondence of temperature anomalies with portions of the borehole with low resistivities (black interval).