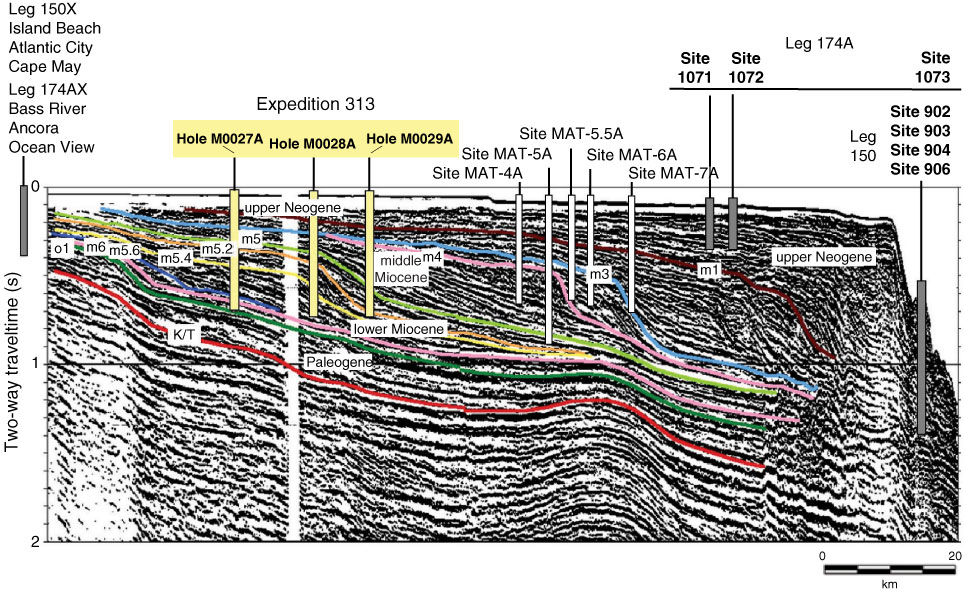
Figure F2. Ew9009 Line 1003 through Holes M0027A, M0028A, and M0029A (yellow subseafloor columns; see Fig. F1 for location). Generalized locations of ODP boreholes onshore and offshore (gray columns) and previously proposed but undrilled Sites MAT-4A to MAT-7A (white columns) are also shown. Several key surfaces (colored lines; K/T boundary = ~65 Ma, o1 = ~33.5 Ma, m5 = ~16.5 Ma, m4 = ~14 Ma, m3 = ~13.5 Ma, and m1 = ~11.5 Ma) have been traced from the inner shelf to the slope. The clinoform shape of sediments bracketed by these unconformities is thought to be the result of large sea level fluctuations (Vail and Mitchum, 1977).
Previous | Close | Next | Top of page