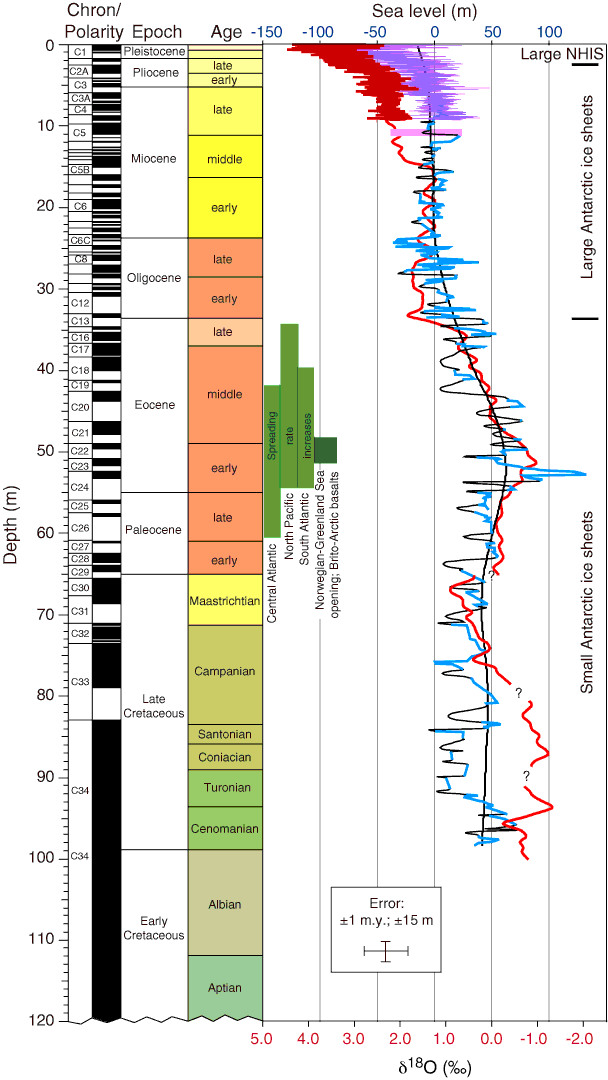
Figure F4. Global sea level (light blue) for the interval 7–100 Ma derived by backstripping data from onshore boreholes along the New Jersey Coastal Plain. Global sea level (purple) for the interval 0–7 Ma is derived from δ18O. A benthic foraminifer δ18O synthesis from 0 to 100 Ma (red curve; scale on bottom axis in permil reported to Cibicidoides values [0.64‰ lower than equilibrium]) is shown for comparison. Pink box at ~11 Ma = sea level estimate derived from the Marion Plateau (see text). Heavy black line = long-term fit to the backstripped curve. Pale green boxes = times of spreading rate increases on various ocean ridges. Dark green box = opening of Norwegian-Greenland Sea and concomitant extrusion of Brito-Arctic basalts. NHIS = Northern Hemisphere ice sheets. (After Miller et al., 2005a.)
Previous | Close | Next | Top of page