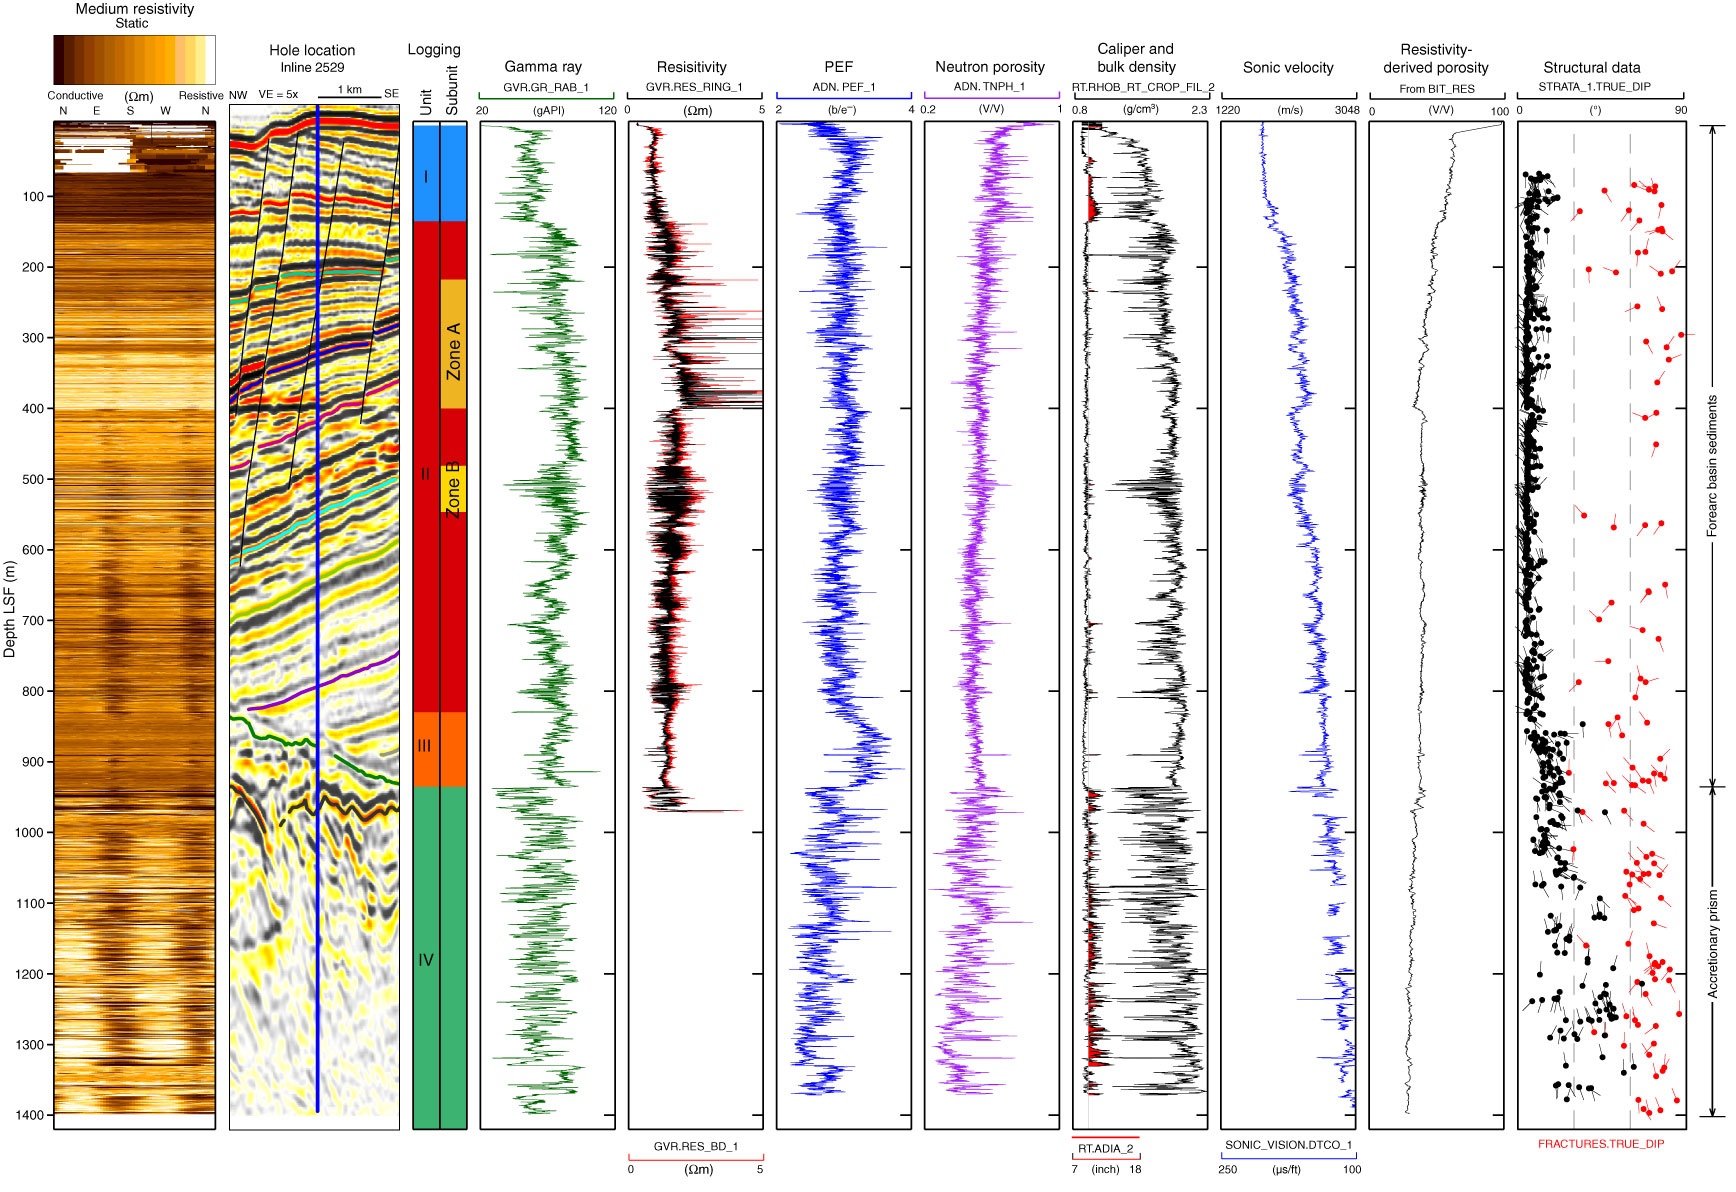
Figure F11. Summary log diagram from Site C0002. Bedding (STRATA_TRUE_DIP) and fracture dips (FRACTURES_TRUE_DIP) from resitivity at bit image. VE = vertical exaggeration, PEF = photoelectric factor, LSF = LWD depth below seafloor.
Previous | Close | Next | Top of page