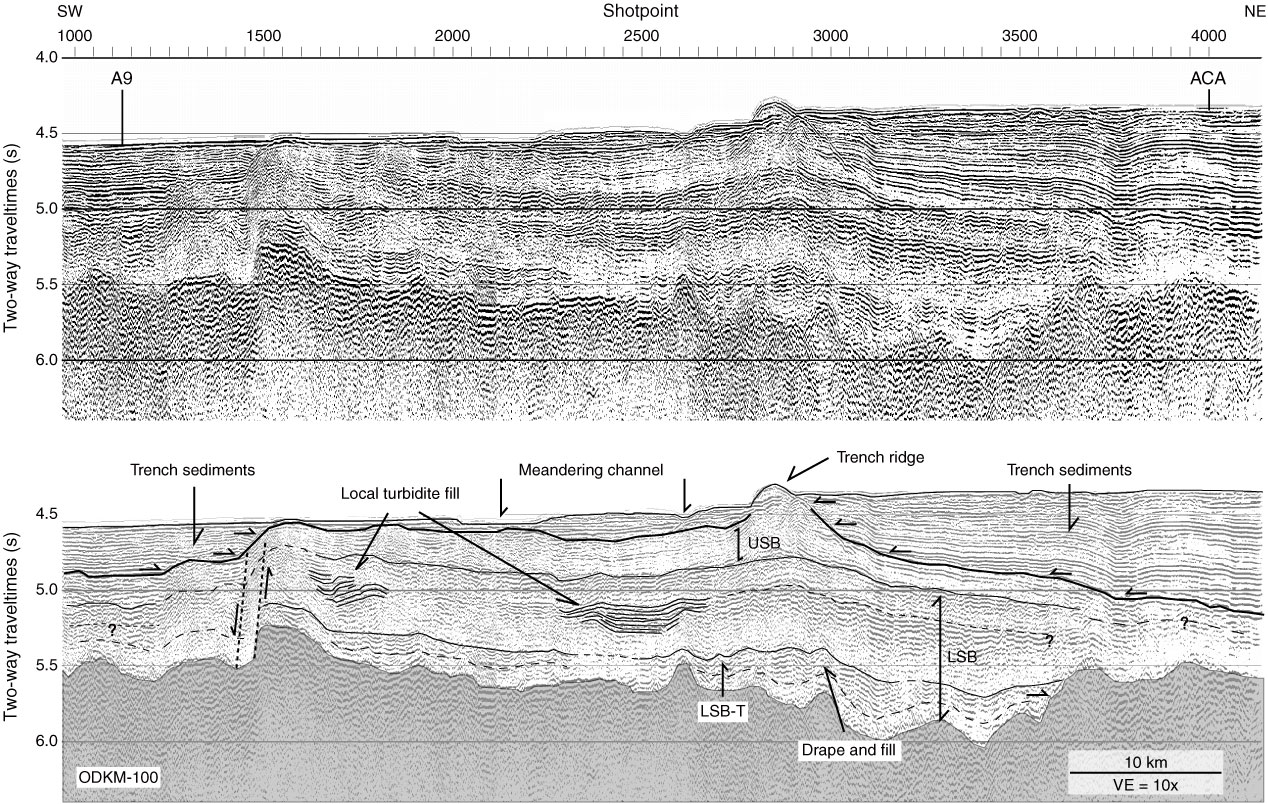
Figure F3. Seismic Profile ODKM-100 along the Nankai Trough axis. Multichannel seismic data obtained by the Center for Deep Earth Exploration, interpretation by T. Ike (pers. comm., 2005). USB = upper Shikoku Basin, LSB = lower Shikoku Basin, LSB-T = lower Shikoku Basin turbidites, VE = vertical exaggeration.
Previous | Close | Next | Top of page