Previous | Close | Next
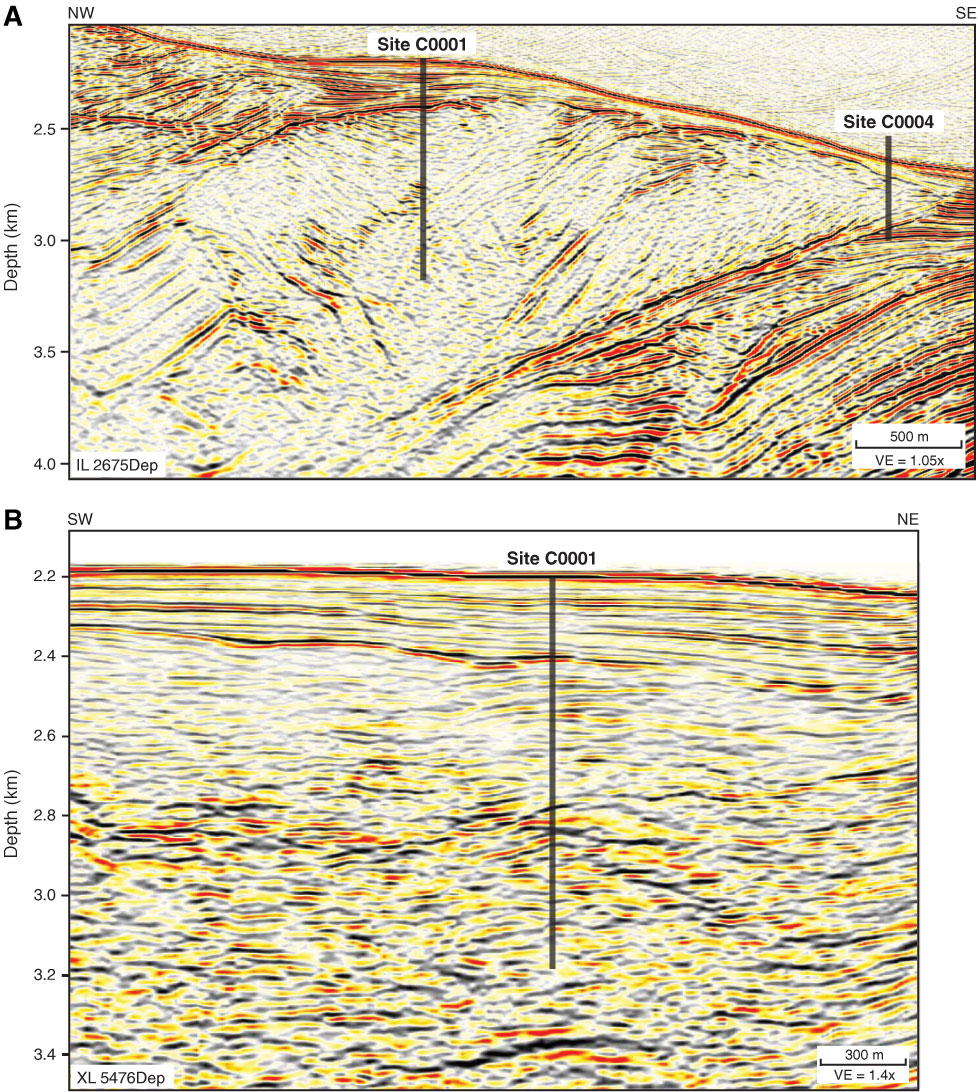
Figure F7. Three-dimensional seismic profiles crossing Site C0001 (Moore et al., 2007). Profile locations plotted in Figures F2 and F8. VE = vertical exaggeration. A. Inline 2675. B. Cross-line 5476.
Previous | Close | Next | Top of page