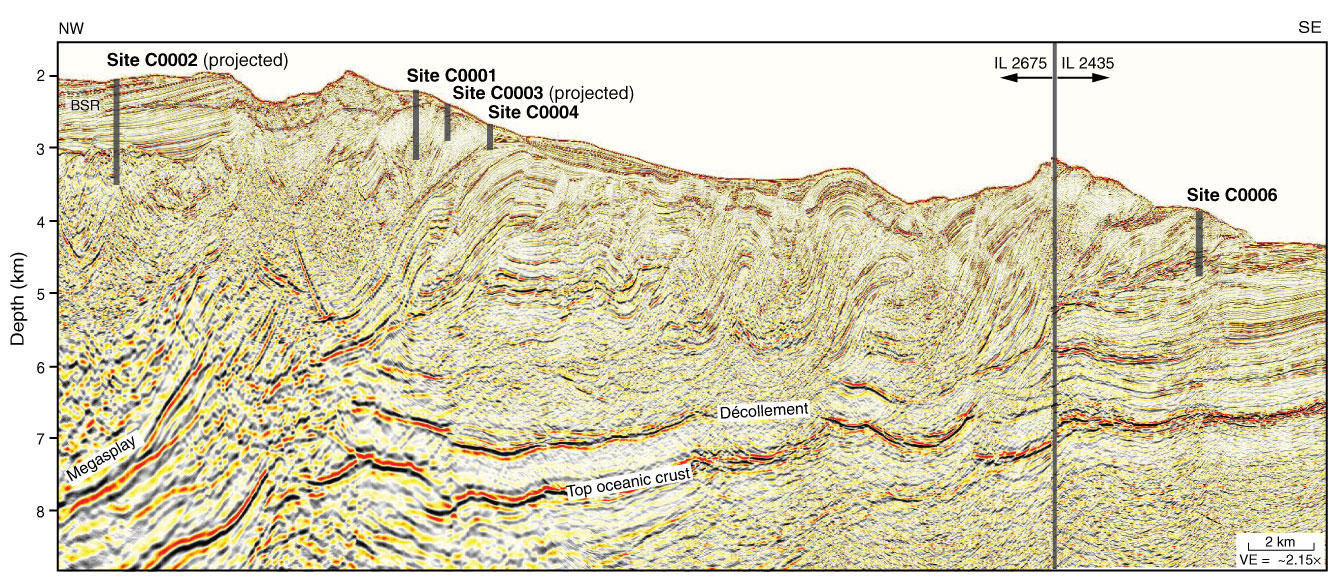
Figure F3. Regional seismic image across the main Stage 1 sites based on 3-D seismic volume (Moore et al., 2007). Note the two inline profiles (IL 2675 and IL 2435) are spliced near the toe of the accretionary prism. Sites C0002 and C0003 are located on different inlines. BSR = bottom-simulating reflector, VE = vertical exaggeration.
Previous | Close | Next | Top of page