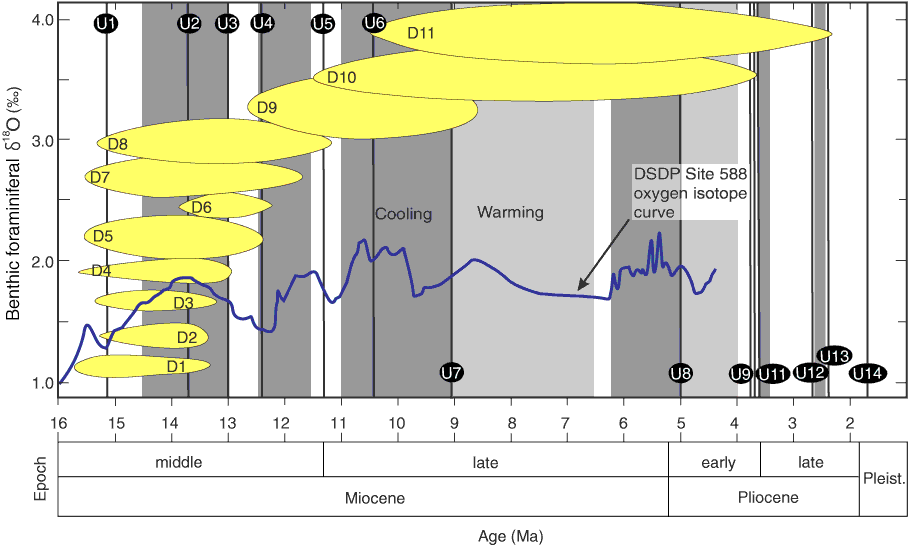
Figure F12. Correlation of sequence boundaries U1–U14 (ages are predrilling estimates and tend to be too old) with periods of activity of sediment drifts and the oxygen isotopic record from DSDP Site 588 in the southwest Pacific (Kennett and von der Borch, 1986). The relative size of the ellipse representing each drift is an approximate measure of drift volume. Drifts D1–D4 are of short duration (~3 m.y.), whereas D10–D11 are larger and longer lived (~7 m.y.). Dark and light shading represent cool and warm periods, respectively, as defined by Kennett and von der Borch. (1986).

Previous | Close | Next | Top of page