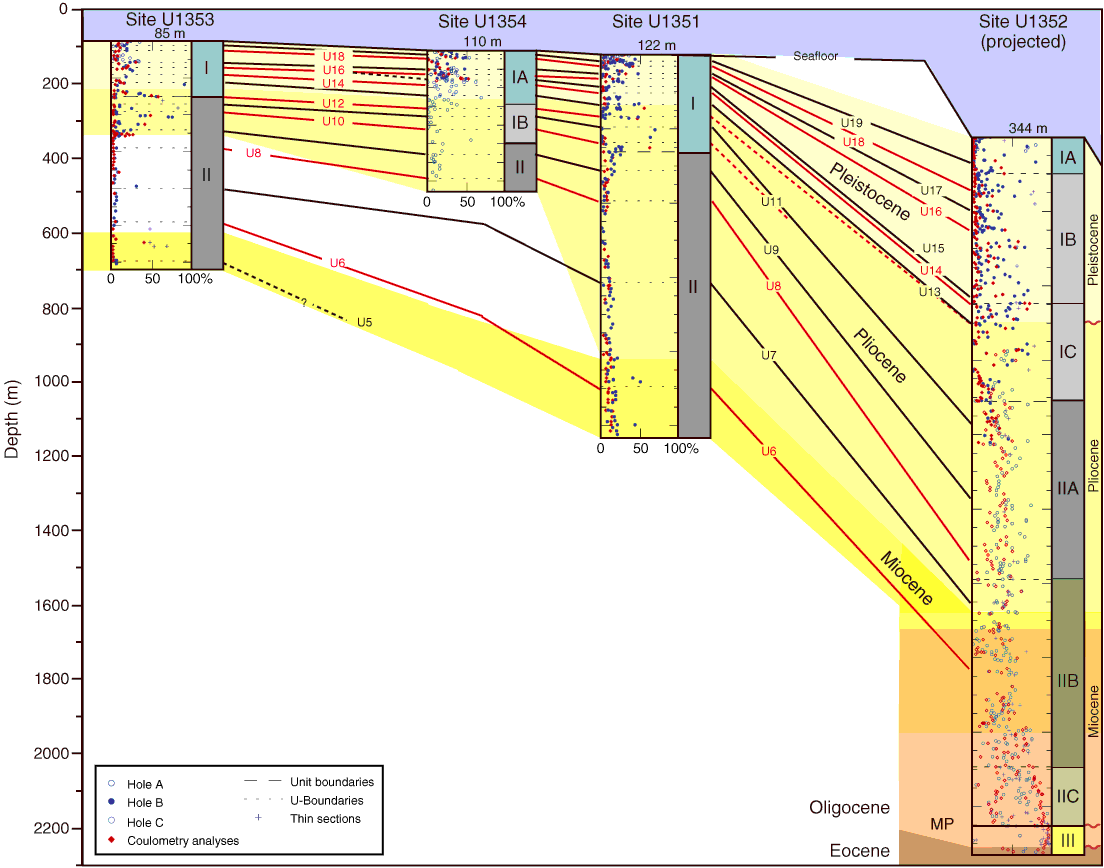
Figure F16. Carbonate component percent estimates from smear slide data (blue circles), plotted with carbonate percent from coulometry analyses (red diamonds), and carbonate estimates from thin sections (purple crosses). Seismic sequence boundaries U19–U5 are shown schematically, intersecting each site at their predicted depths. Ages were determined from biostratigraphy. MP = Marshall Paraconformity.

Previous | Close | Next | Top of page