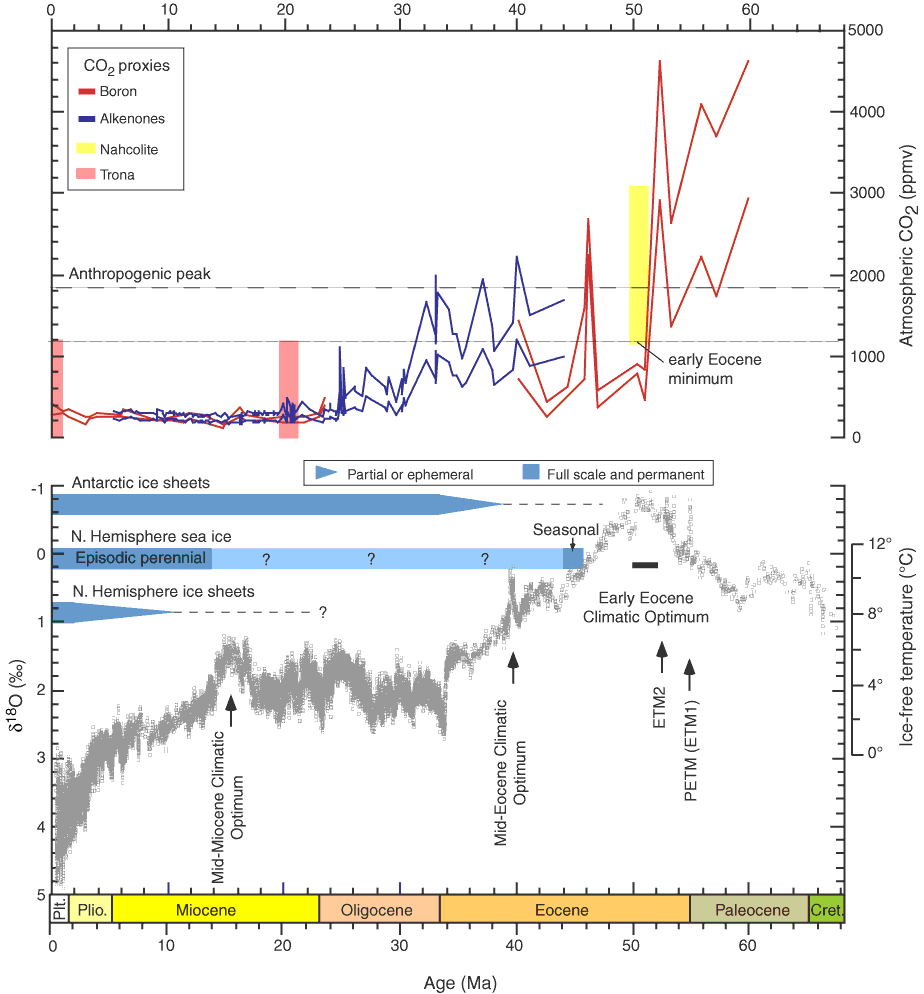
Figure F1. Updated Cenozoic pCO2 and stacked deep-sea benthic foraminifer oxygen isotope curve for 0 to 65 Ma. Updated from Zachos et al. (2008) and converted to the Gradstein timescale (Gradstein et al., 2004). ETM2 = Eocene Thermal Maximum 2, PETM = Paleocene/Eocene Thermal Maximum, ETM1 = Eocene Thermal Maximum 1.

Close | Next | Top of page