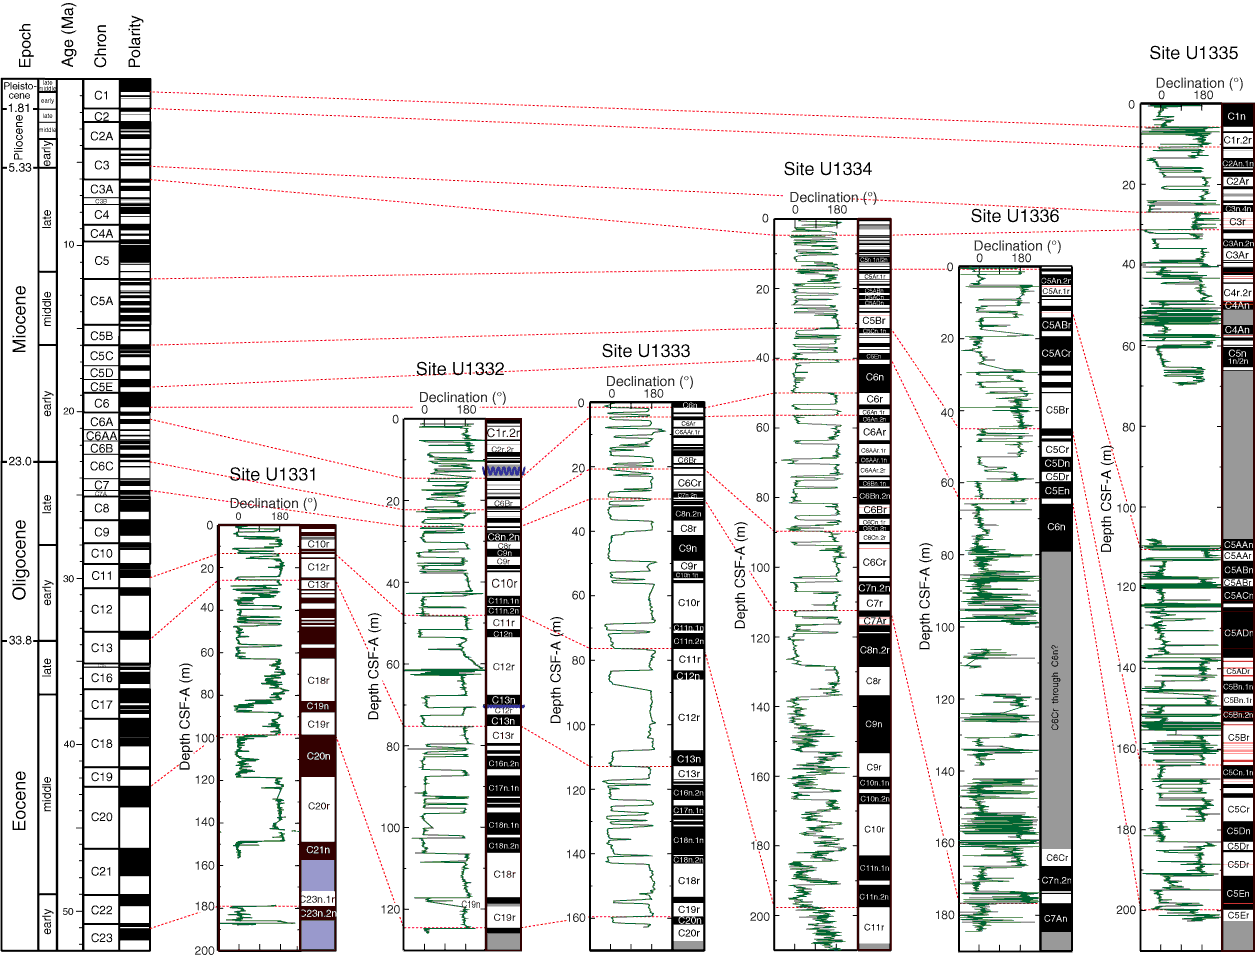
Figure F18. Synthesis for downhole variation of paleomagnetic declination (green curves) along with magnetostratigraphic interpretations for Expedition 320 drill sites. Red bars = possible geomagnetic excursions. CSF-A = core depth below seafloor, method A.

Previous | Close | Next | Top of page