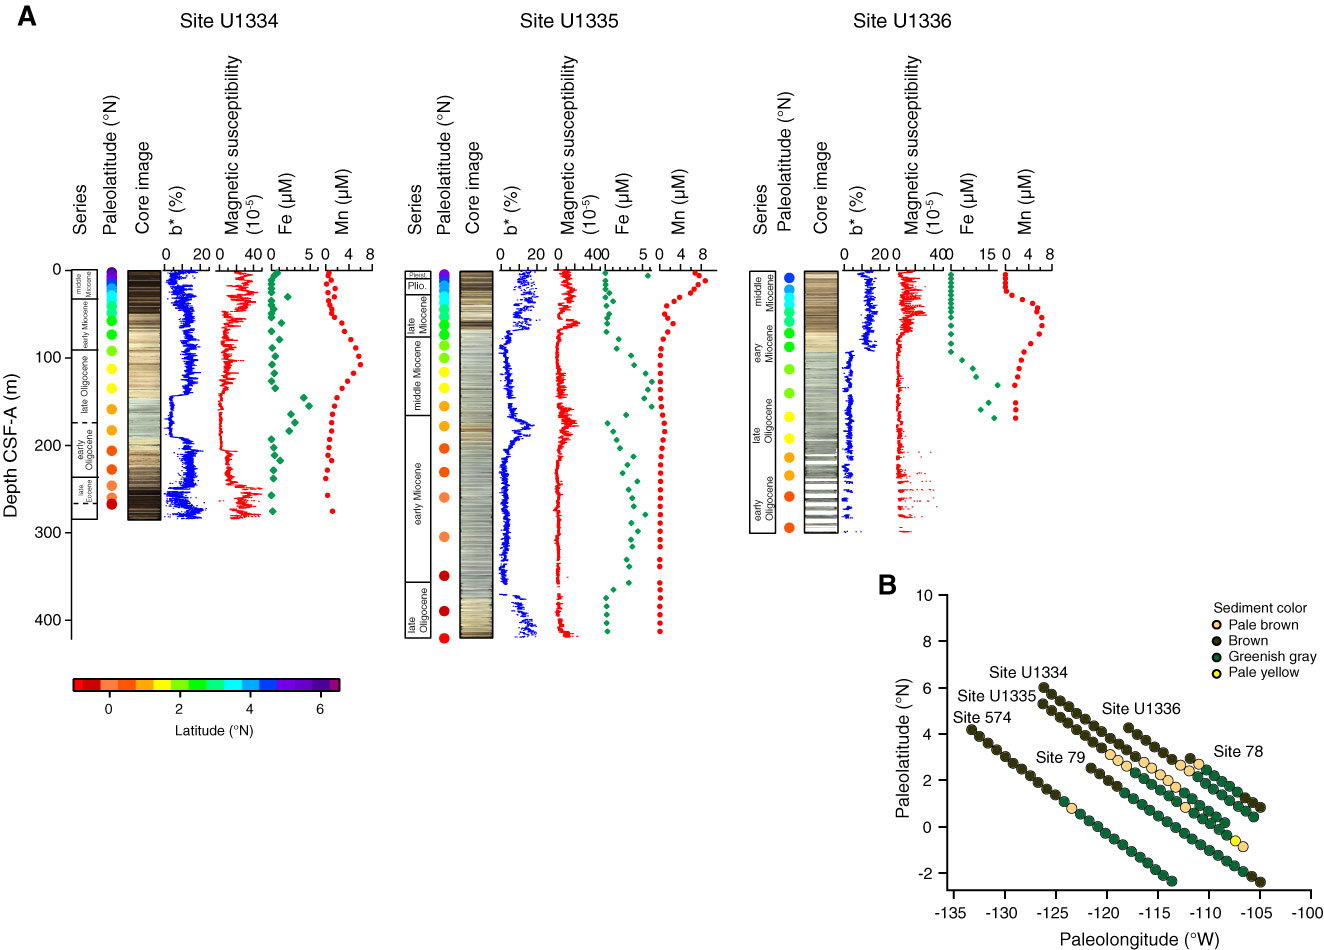
Figure F32. Summary of sediment color and interstitial water chemistry changes. A. Geologic series, paleolatitude, stacked line scan core images, b* reflectance, magnetic susceptibility, dissolved Fe, and dissolved Mn concentrations are plotted vs. depth for Sites U1334, U1335, and U1336. B. Sediment color changes superimposed on site backtrack curves for Expedition 320 Sites U1334, U1335, and U1336 and DSDP Sites 78, 79, and 574, as interpreted from visual core descriptions.
Previous | Close | Next | Top of page