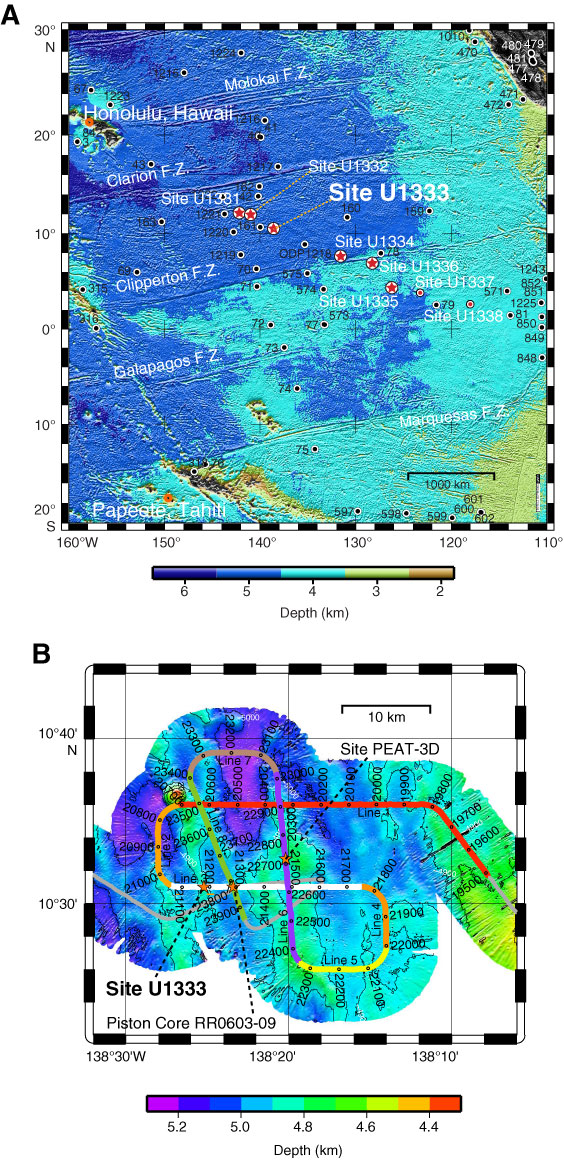
Figure F49. A. ETOPO1 (Amante and Eakins, 2008) bathymetric overview map of Site U1333 and PEAT drilling locations, with previous ODP and DSDP sites. B. Swath map bathymetry for Site U1333 region from the AMAT-03 site survey. Black labels = seismic shotpoints, white labels = bathymetric contours. White line = part of the seismic reflection profile across Site U1333.
Previous | Close | Next | Top of page