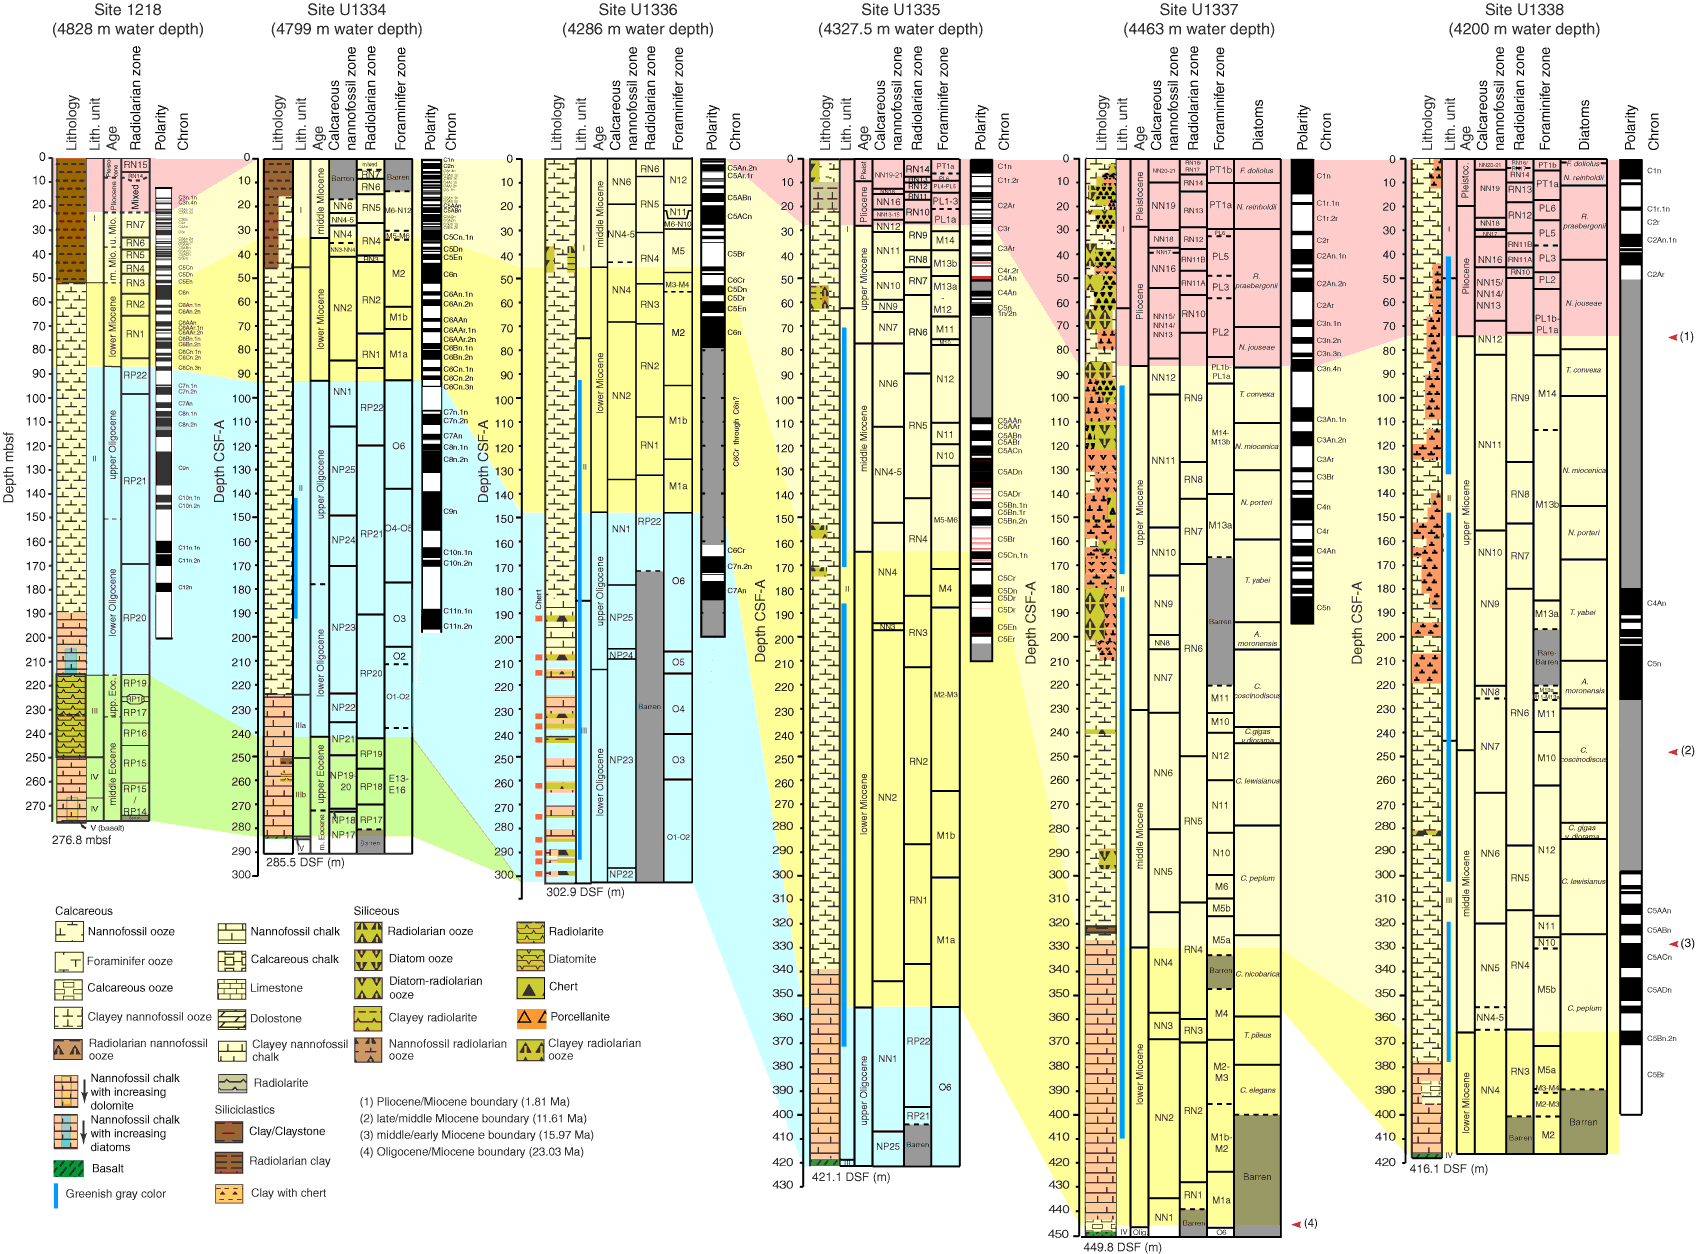
Figure F13. Stratigraphic summary plots, PEAT Sites U1334–U1338 and ODP Site 1218. Green = Eocene, blue = Oligocene, yellow = Miocene, pink = Pliocene–Pleistocene. CSF-A = core depth below seafloor, method A; DSF = drilling depth below seafloor.

Previous | Close | Next | Top of page