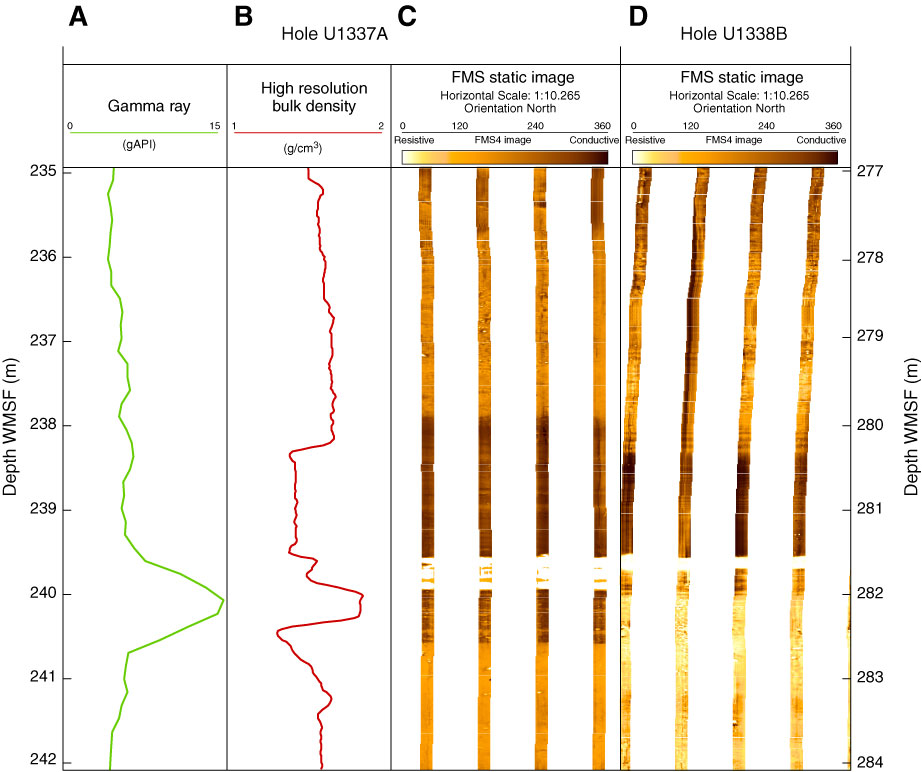
Figure F26. Formation MicroScanner (FMS) and downhole log curves highlighting the location of a thin "baby chert" layer at Sites U1337 (A, B, and C) and U1338 (D). A. Total gamma ray measured by Hostile Environment Gamma Ray Sonde (triple combination tool string). B. Bulk density measured by Hostile Environment Litho-Density Sonde. C, D. FMS four-pad downhole resistivity images. Depth interval of baby chert layer in A and B is slightly offset (~0.4 m) from the FMS image (C). WMSF = wireline log matched depth below seafloor.
Previous | Close | Next | Top of page