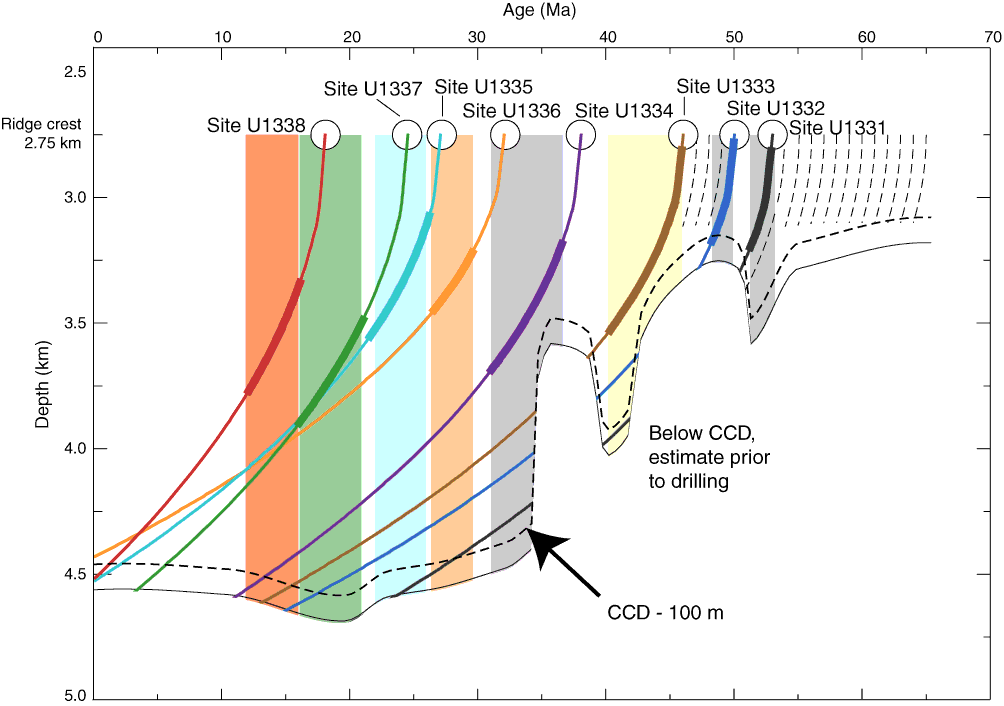
Figure F3. Targeting drill sites based on calcium carbonate compensation depth (CCD) history (van Andel, 1975), with new data from Leg 199 prior to coring. Colored boxes = critical time interval targeted for each site. Colored subsidence lines = time intervals when we expected carbonate to be deposited (i.e., when site is above CCD). Subsidence curves use a subsidence parameter calculated from estimated basement age of PEAT sites and their present-day depth (k = ~0.35). Additional subsidence caused by sediment loading was not modeled.
Previous | Close | Next | Top of page