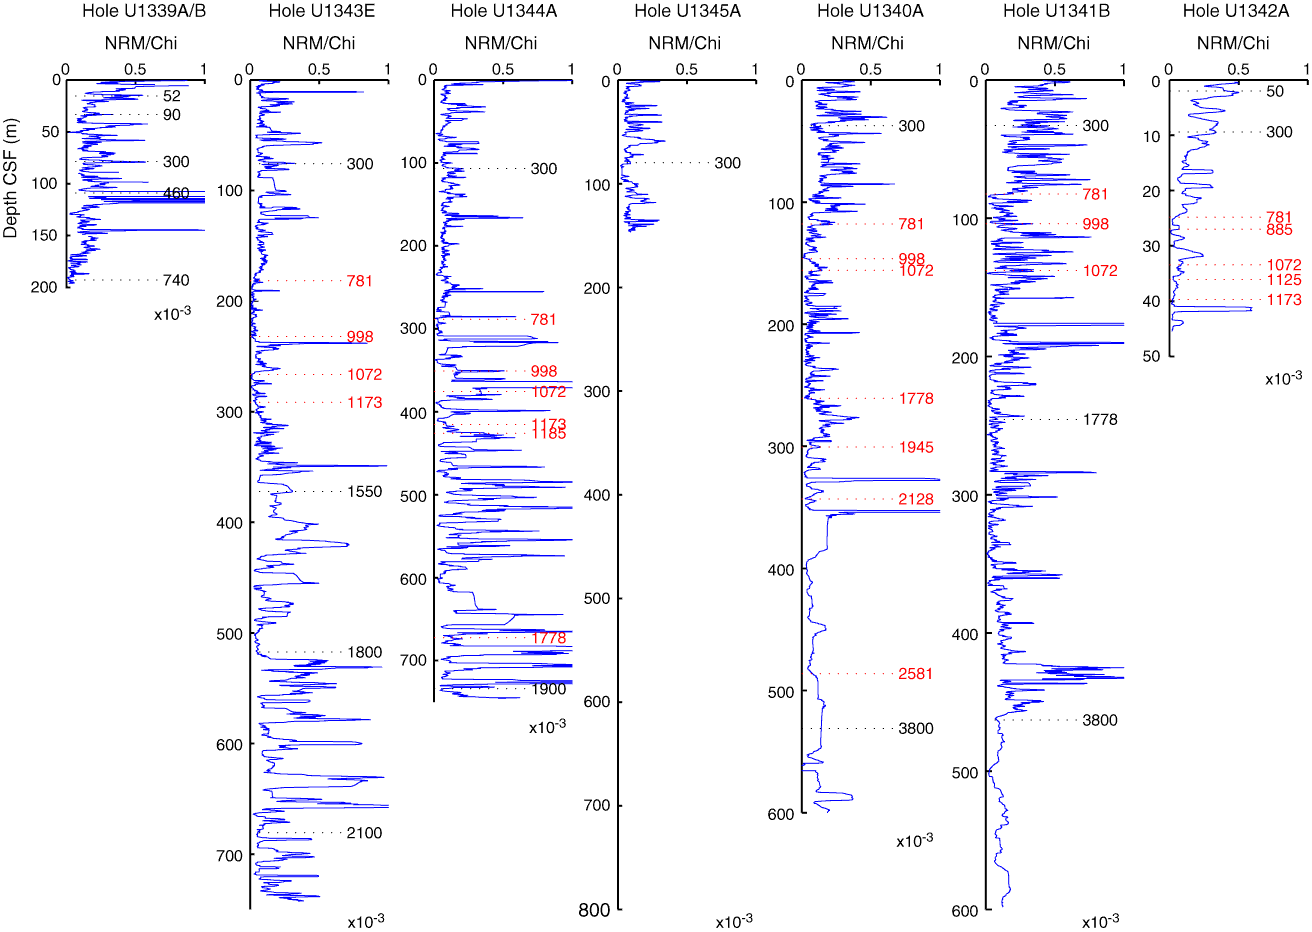
Figure F8. Variations in natural remanent magnetization/Chi (NRM/Chi) or relative paleointensity along with the biostratigraphic (black) and paleomagnetic (red) age estimates for the seven drill sites (from Tables T6, T10, T14, T18, T22, T26, and T30) in k.y.

Previous | Close | Next | Top of page