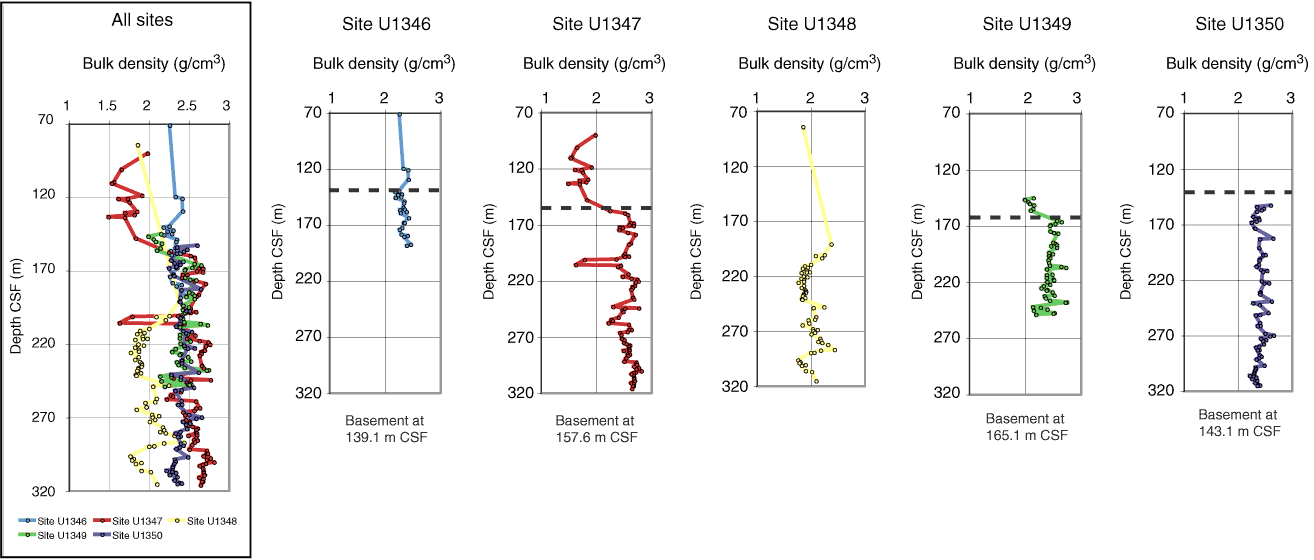
Figure F30. Summary of GRA bulk density measured from core sections, Expedition 324. Maxium value per section plotted at depth where that maximum occurs, meaning that features such as sediment interbeds with lower GRA densities than igneous material are not visible in this figure. Dashed line = contact between sediments and igneous basement.

Previous | Close | Next | Top of page