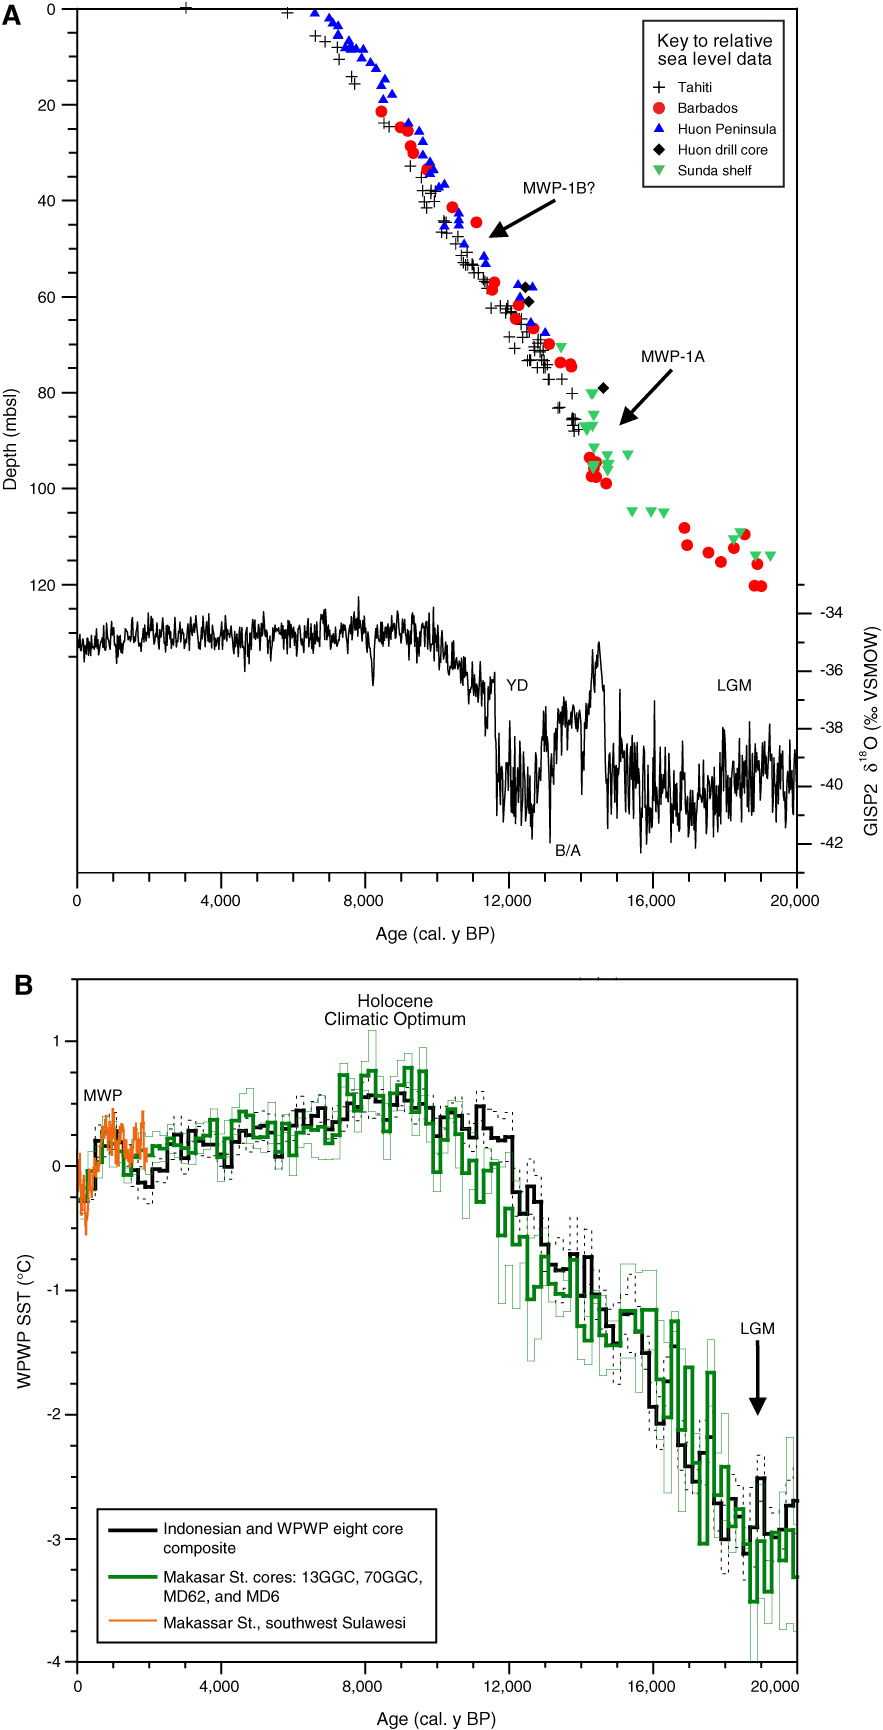
Figure F1. A. Previously published data on relative sea level from 20 cal. y BP through present (upper symbols) plotted with GISP2 δ18O (proxy for temperature over Greenland; black line) for comparison, Expedition 325. Meltwater pulse 1A (MWP-1A) refers to an interval of particularly rapid sea level rise during the last deglaciation. MWP-1B = meltwater pulse 1B. YD = Younger Dryas, B/A = Bölling Alleröd, LGM = last glacial maximum. Source of data: Tahiti = Bard et al., 1996, 2010. Huon Peninsula = Chappell and Polach 1991; Edwards et al., 1993. Huon drill core = Cutler et al., 2003. Sunda shelf = Hanebuth et al., 2000. Barbados = Fairbanks, 1989; Bard et al., 1990. GISP2 = Stuiver and Grootes, 2000). B. Planktonic foraminifer Mg/Ca records of mixed-layer temperatures in the western sector of the Western Pacific Warm Pool (WPWP). Comparison of Indonesian and WPWP Globigerinoides ruber Mg/Ca-based sea-surface temperature (SST) anomaly records modified from Linsley et al. (in press). Anomalies calculated as departures relative to average of last 2,000 y. Data shown are 200 y nonoverlapping binned averages of eight cores throughout the western sector of the WPWP (black) and average of only four southern Makassar region cores (green) (see Linsley et al., in press). Orange SST data are from Oppo et al. (2009) for only the southern Makassar Strait. Light green and dashed bounding lines show the standard error (SE) of all measurements in each 200 y bin. The LGM, Holocene Climatic Optimum, and Medieval Warm Period (MWP) are indicated. Composite reconstruction indicates that SSTs in this broad region of the WPWP warmed ~3°C after the LGM and reached a maximum 0.5°C higher than in preindustrial times from ~10,000 to 7,000 y cal. BP during the Holocene Climatic Optimum.
Close | Next | Top of page