Previous | Close | Next
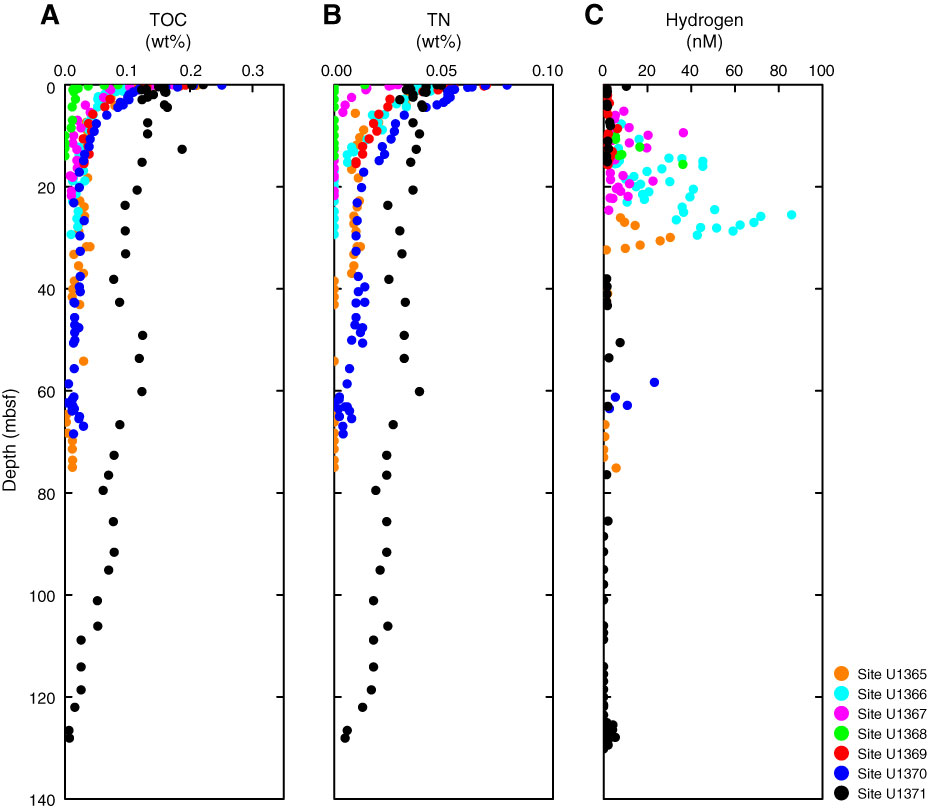
Figure F10. Plots of electron donor concentrations vs. depth, Sites U1365–U1371. A. Total organic carbon (TOC; solid phase). B. Total nitrogen (TN; solid-phase organic nitrogen). C. Dissolved H2.
Previous | Close | Next | Top of page