Previous | Close | Next
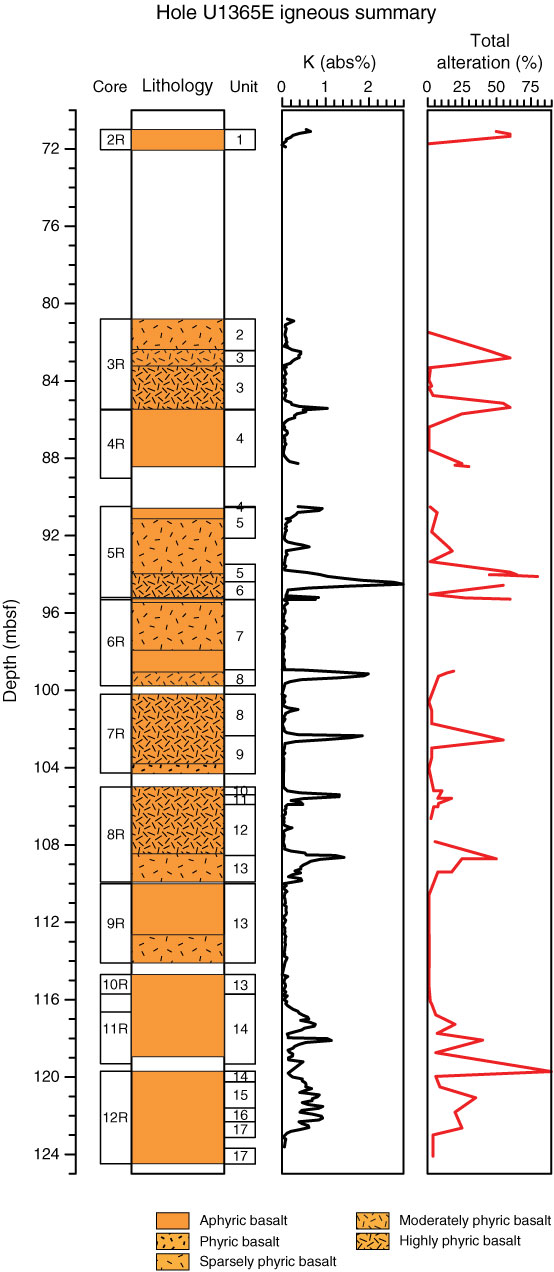
Figure F14. Illustration of relationship between igneous units, visually observed alteration intensity, and percent potassium content (determined by NGR core logging), Hole U1365E.
Previous | Close | Next | Top of page