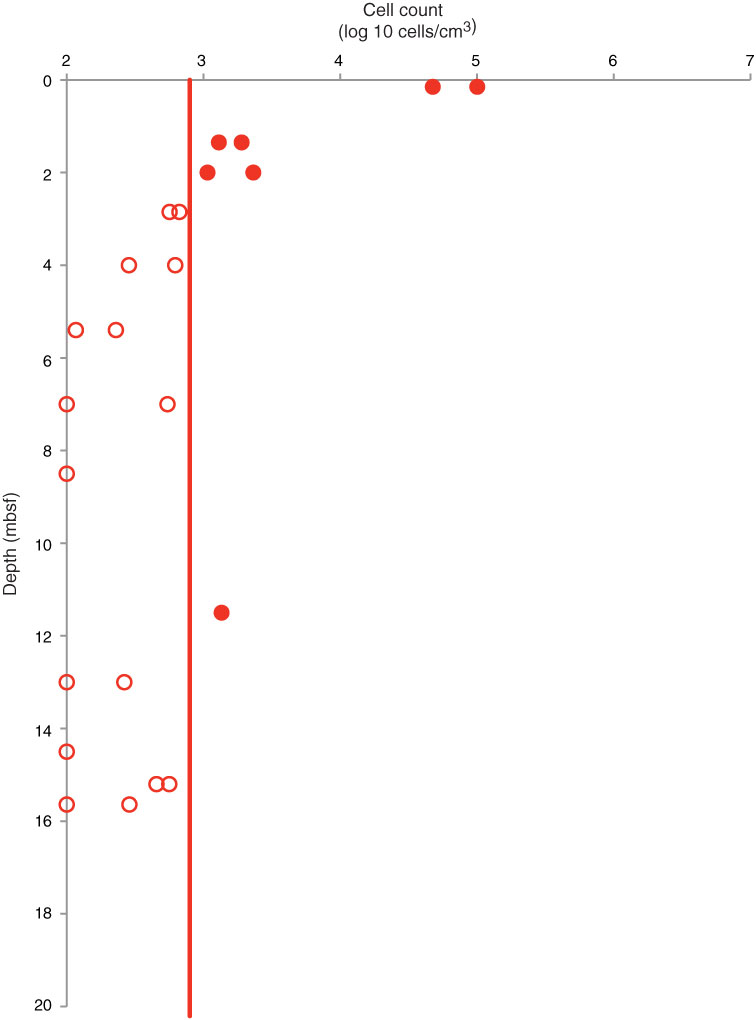
Figure F30. Plot of microbial cell counts, Site U1369. Solid circles = microbial cell abundances quantified by epifluorescence microscopy (direct counts), open circles = direct counts below minimum detection limit (red line). Cell counts below the blank are shown as 102 cells/cm3 in order to present them in the graph.
Previous | Close | Next | Top of page