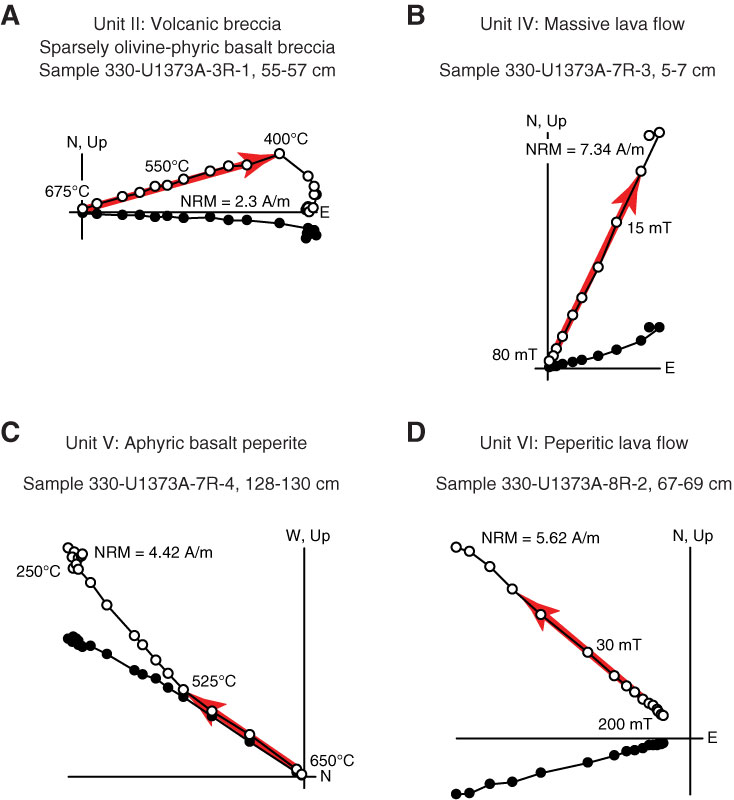
Figure F32. Representative Zijderveld plots by rock type for stepwise (A, C) thermal and (B, D) alternating-field demagnetization results of discrete samples taken from stratigraphic Units II and IV–VI. Solid and open circles indicate projections of vector endpoints onto the horizontal and vertical planes, respectively. Red arrows indicate direction derived from principal component analysis. NRM = natural remanent magnetization.
Previous | Close | Next | Top of page