Previous | Close | Next
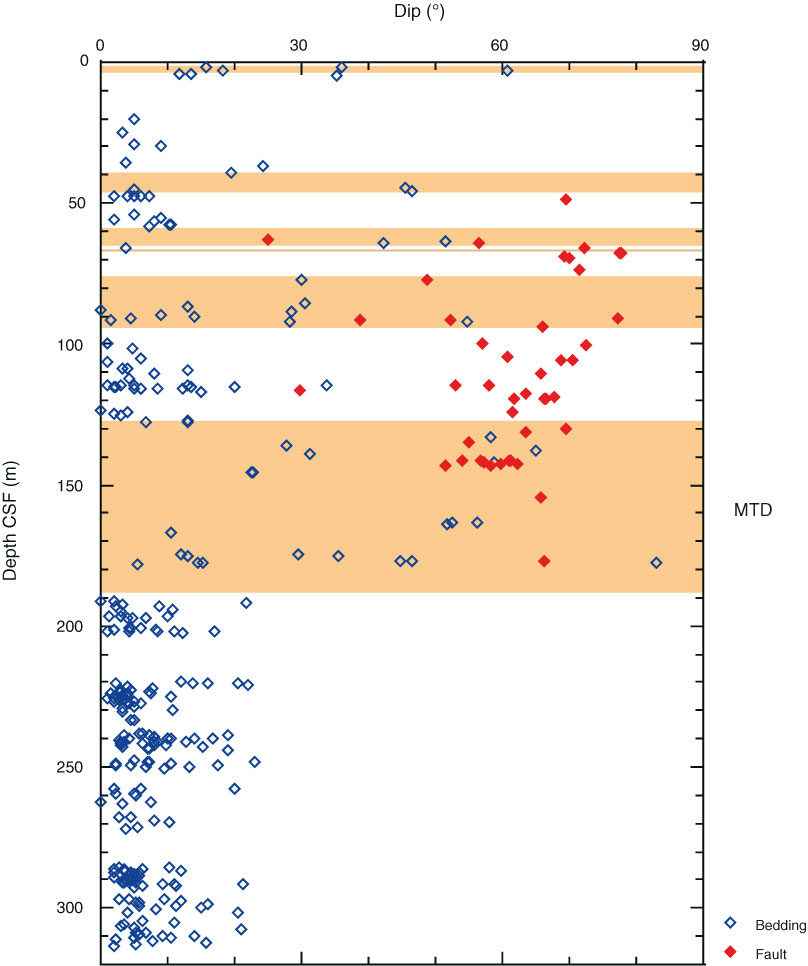
Figure F12. Distribution of bedding dip angles and deformation structures with depth. Orange bands = depth range of mass transport deposits (MTDs).
Previous | Close | Next | Top of page