Previous | Close | Next
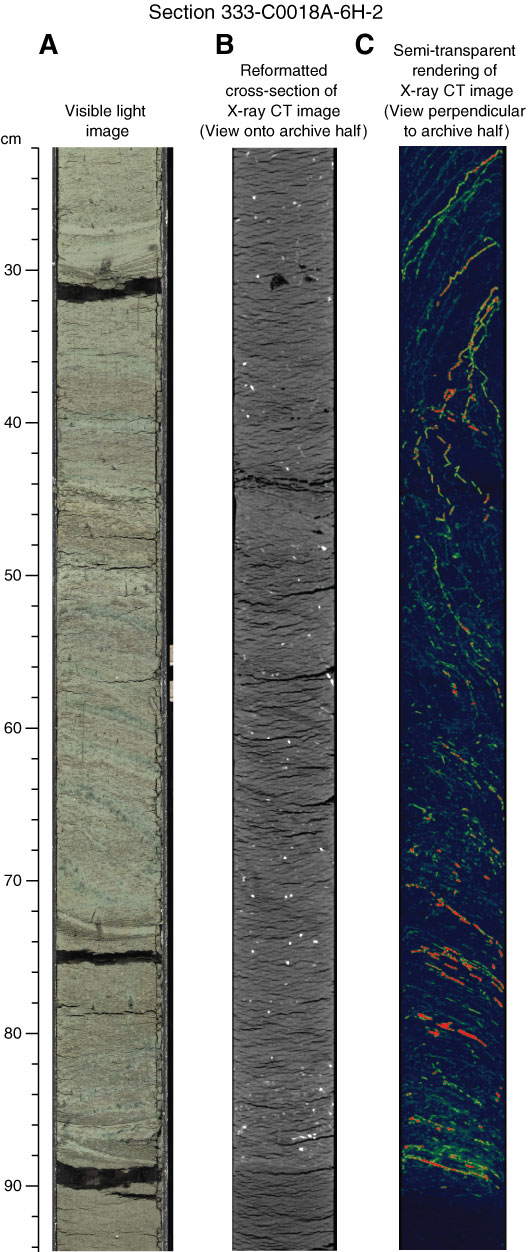
Figure F6. Shear zone at base of MTD 2. A. Core photo. B. Computed tomography (CT) scan. C. CT scan 3-D rendering showing high CT pyrite lines.
Previous | Close | Next | Top of page