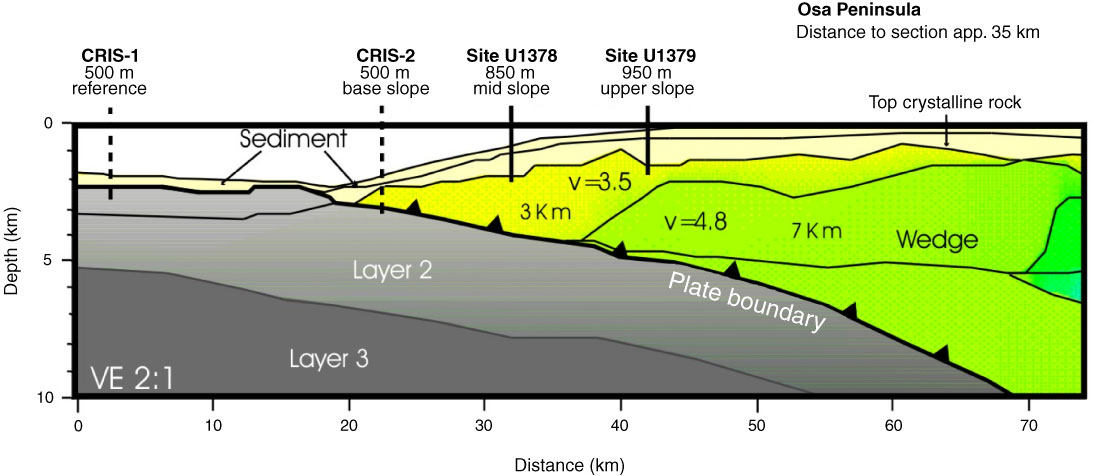
Figure F3. Interpreted wide-angle seismic section (TICOSECT profile 300) from Stavenhagen et al. (1998). Schematic figure through Osa Peninsula margin showing Sites U1378 and U1379 and alternate Sites CRIS-1 and CRIS-2. VE = vertical exaggeration, v = P-wave velocity.