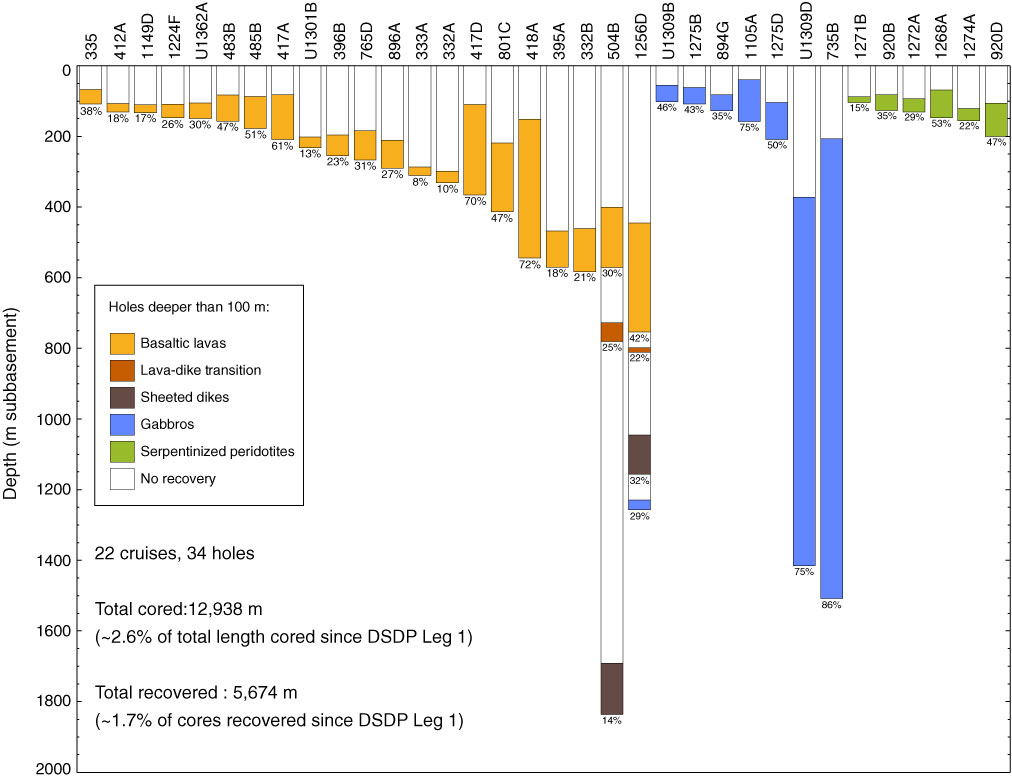
Figure F4. Compilation chart showing holes drilled >100 m in intact crust and tectonically exposed lower crust and upper mantle from 1974 to 2010 (localization in Fig. F3). For each hole are indicated the hole number and the recovery (in percent) for each lithology. This compilation does not include “hard rock” drill holes in oceanic plateaus, arc basement, hydrothermal mounds, or passive margins.
Previous | Close | Next | Top of page