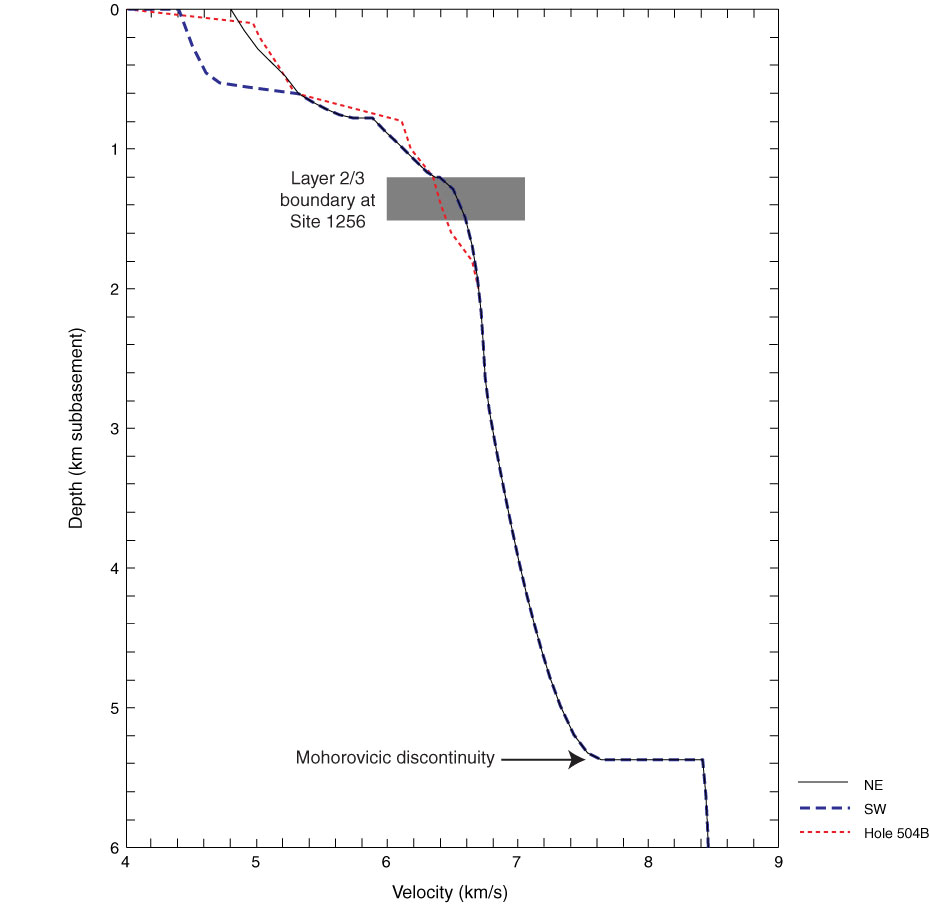
Figure F9. One-dimensional velocity model based on inversion of refraction data. At shallow depths, separate inversions were performed on northeast (NE) and southwest (SW) data subsets, with slightly faster velocities found to the northeast where abyssal hill topography is very subdued. The Layer 2/3 boundary is present in the depth range 1.2–1.5 km. The velocity model of Detrick et al. (1994) for Site 504, also based on ocean bottom hydrophone refraction data, is shown for comparison. Apparent differences are dominated by differences in the inversion techniques, but the differences at 1.3–1.7 km may be barely above uncertainty.

Previous | Close | Next | Top of page