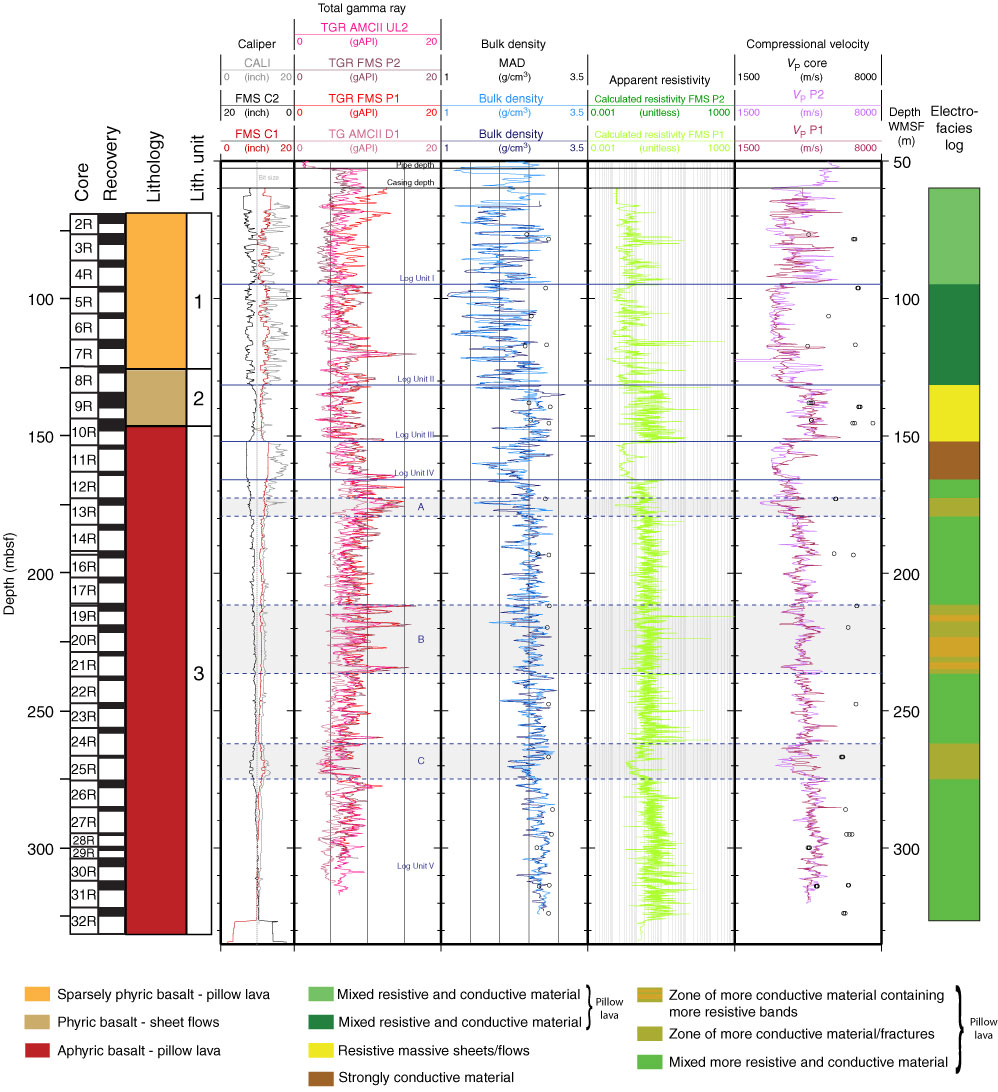
Figure F8. Summary of Hole U1383C logging results. Blue lines = log unit divisions, black lines = limits of pipe and casing. Measurements include borehole diameter (FMS C1, C2 = Formation MicroScanner [FMS] Pass 1; CALI = adapted microbiology combination II [AMC II] Uplog 1), gamma ray (TGR AMCII UL2 = total gamma ray from AMC II Uplog 2; TGR FMS P1, P2 = total gamma ray from FMS-sonic Pass 1, Pass 2; TGR AMCII D1 = total gamma ray from AMC II Downlog 1), density (bulk density = from AMC II Uplogs 1 and 2; MAD = moisture and density testing on discrete core samples), apparent resistivity (calculated resistivity FMS P2, FMS P1 = calculated resistivity from FMS pad average from Pass 1, Pass 2), compressional velocity (VP core = from discrete core cube samples; VP P1, P2 = from FMS-sonic Pass 1, Pass 2). A summary of core recovery and lithologic units is provided at the far left, and on the far right is electrical stratigraphy based on FMS electrical images.
Previous | Close | Next | Top of page