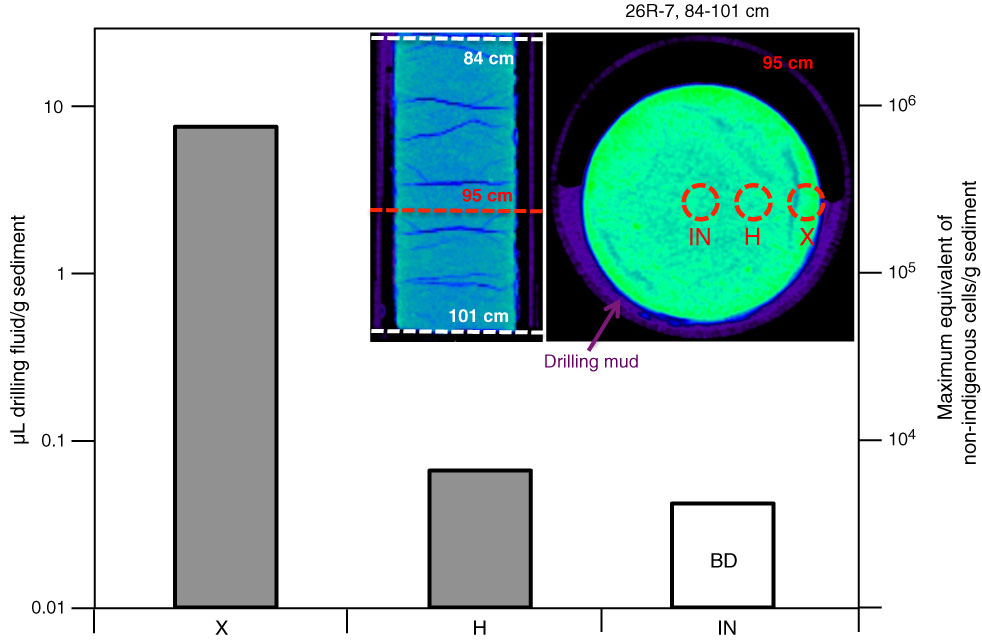
Figure F16. Change in drilling fluid contamination and predicted number of drilling-induced contaminant cells, from the outer centimeter of cores (X), to halfway between the core liner and core center (H), to the innermost part (IN), using Sample 337-C0020A-26R-7, 84–101 cm (Code: MBIO-COM) as an example. PFC concentrations were below detection (BD) in the innermost part. The empty column shown illustrates the expected contamination at the detection limit and should thus be treated as a maximum value. Only the innermost parts of cores were used for cell counts and DNA extractions on board the ship. The boxed photos show X-ray CT scan images of Core 26R-7, 84–101 cm.
Previous | Close | Next | Top of page