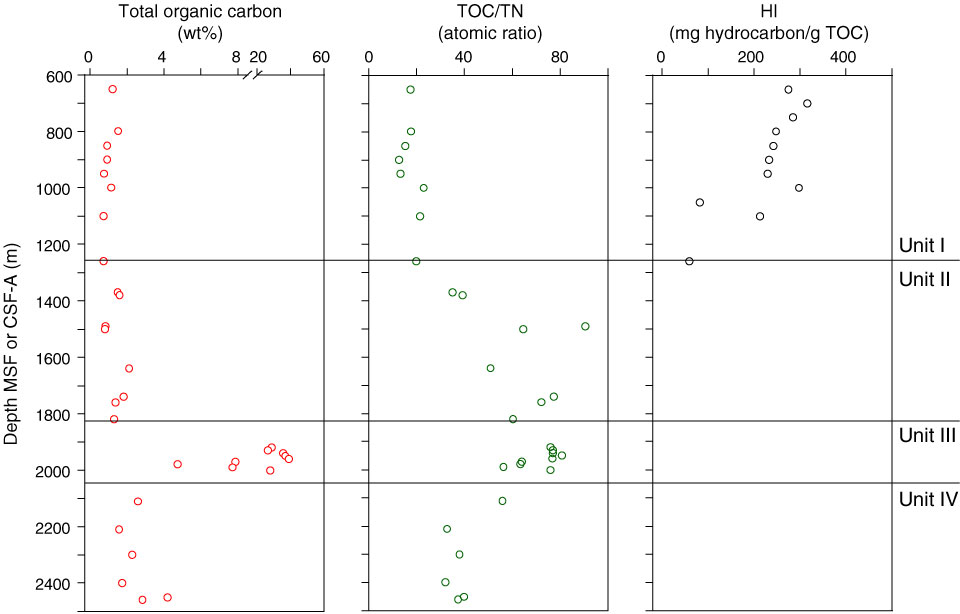
Figure F9. Depth profiles of total organic carbon (TOC), TOC to total nitrogen (TN) ratio, and hydrogen index (HI), Hole C0020A. Open dots = data from cuttings samples, solid dots = data from core samples. All three parameters showed a lithologic control, with values decreasing in the order of coal > clayey materials > silty and sandy materials.
Previous | Close | Next | Top of page