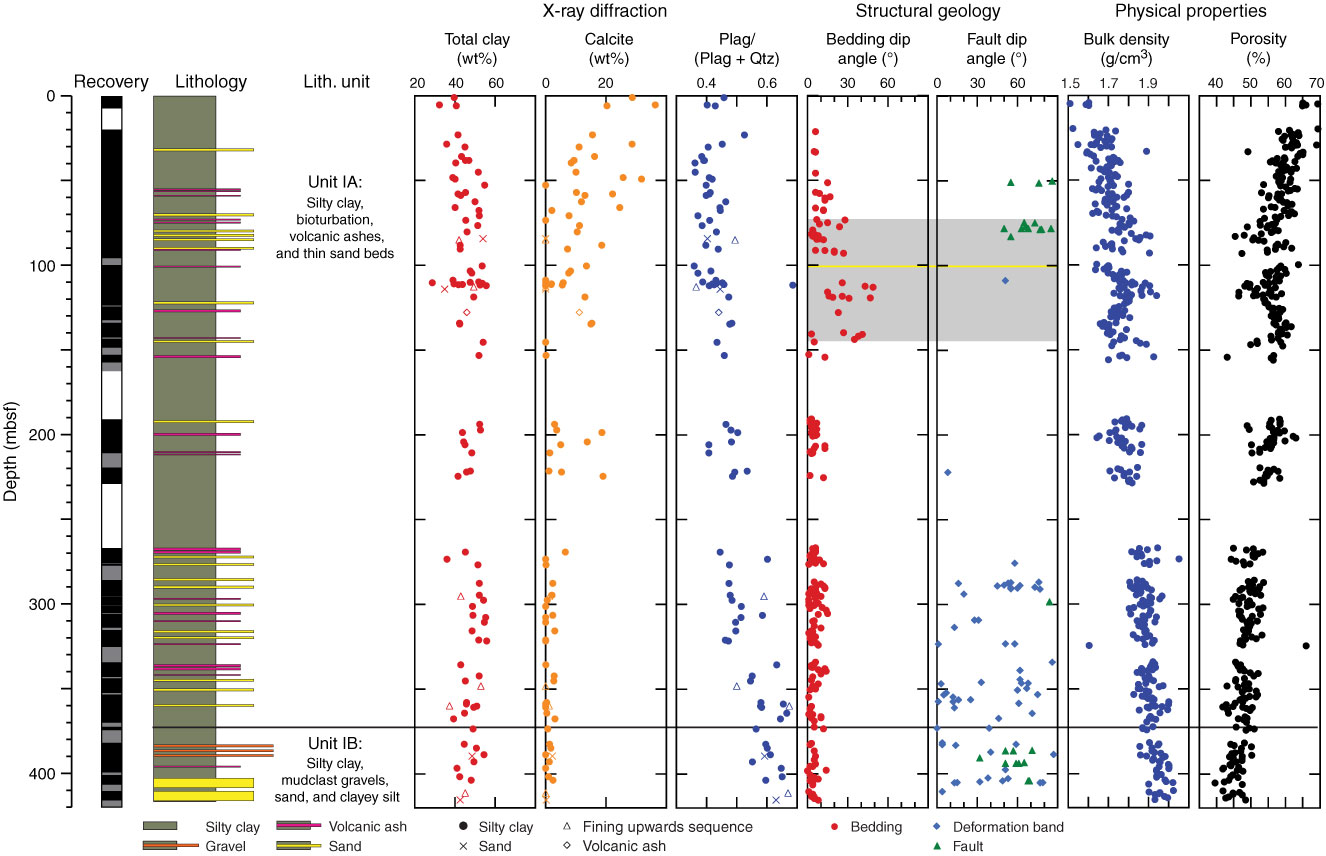
Figure F24. Composite summary of core results, Hole C0022B. Bulk density and porosity are from MAD measurements. Gray shaded zone in the structural geology data corresponds to intervals with dips >15°, including possible location of splay fault (yellow line) as deduced from LWD data in Hole C0022A.
Previous | Close | Next | Top of page