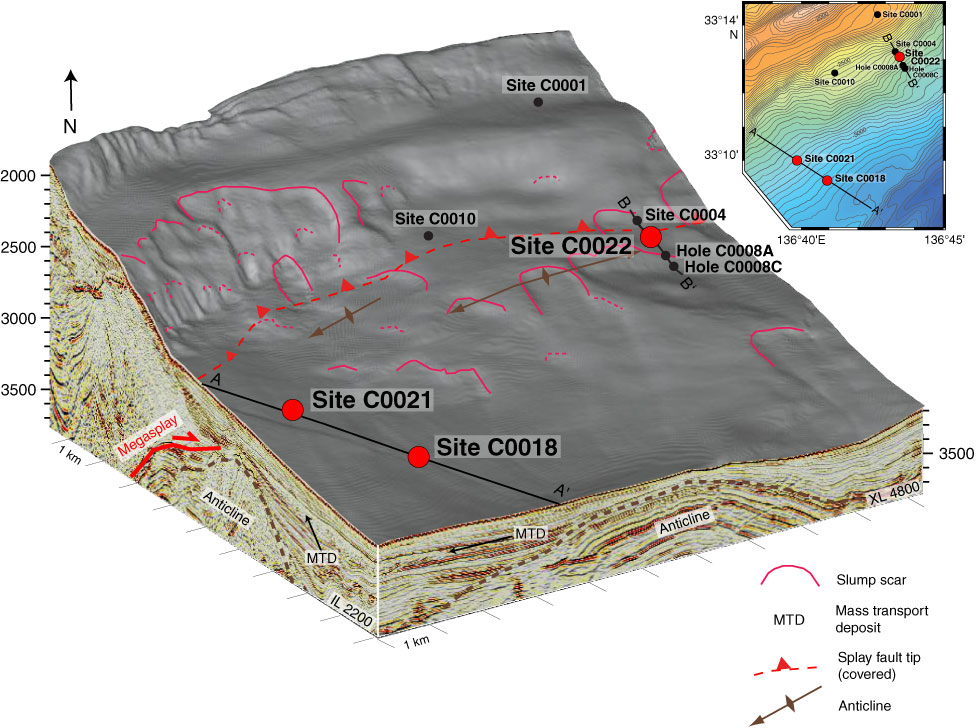
Figure F4. Detailed bathymetry and structure of the slope basin at the footwall of the splay fault (Strasser et al., 2011) showing Expedition 338 sites (red) in relation to NTS Stage 1 and 2 sites. Solid black lines = locations of seismic lines A–A′ and B–B′ in Figures F5 and F6, respectively. MTD = mass transport deposit, IL = in-line, XL = cross-line.
Previous | Close | Next | Top of page