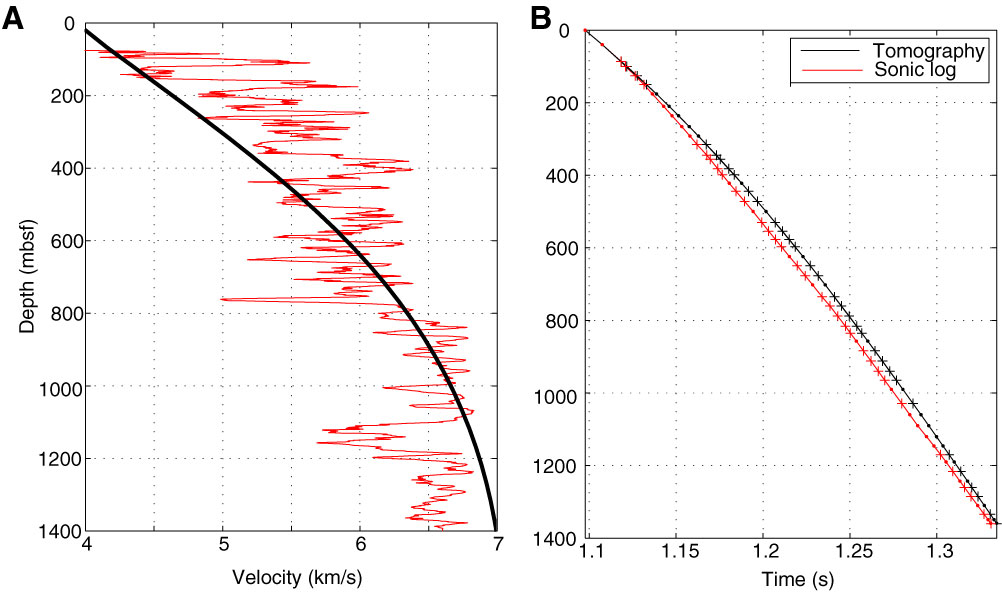
Figure F11. Velocity-depth profile for compressional waves in Hole U1309D and calculated vertical ray traveltimes. A. Black = MCS 3-D tomography model in Hole U1309D, red = running 10 m average of VP data from Expeditions 304, 305, and 340T. B. Predicted vertical traveltime from rig floor to depth in the borehole based on sonic log data and tomography model. Dots = VSP station depths, pluses = stations with good data.
Previous | Close | Next | Top of page