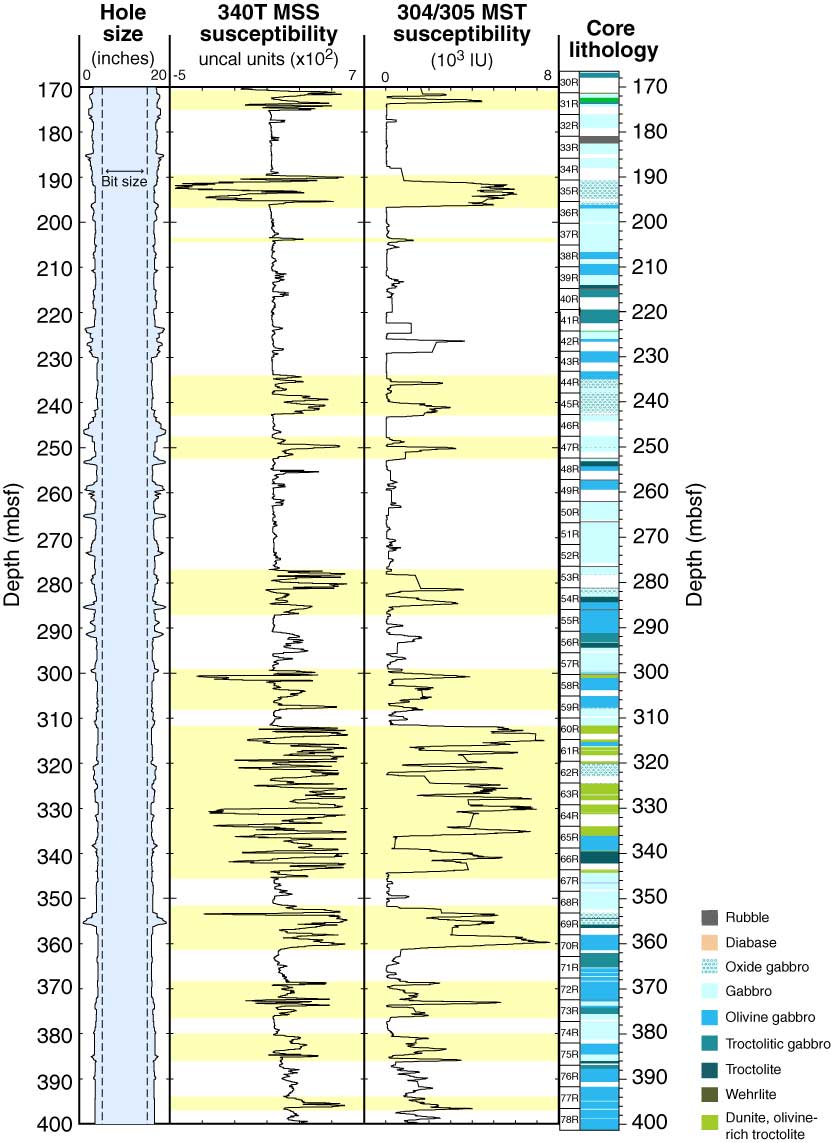
Figure F15. Comparison of core lithology with magnetic susceptibility from Expedition 340T logging data (Magnetic Susceptibility Sonde [MSS]) and Expedition 304/305 core pieces (multisensor track [MST]) (25 point running average). Yellow bands highlight intervals where good correlation is observed between the two data sets. Distinctive features in magnetic susceptibility from logs and cores correspond to serpentinized intervals and oxide gabbro intervals.
Previous | Close | Next | Top of page