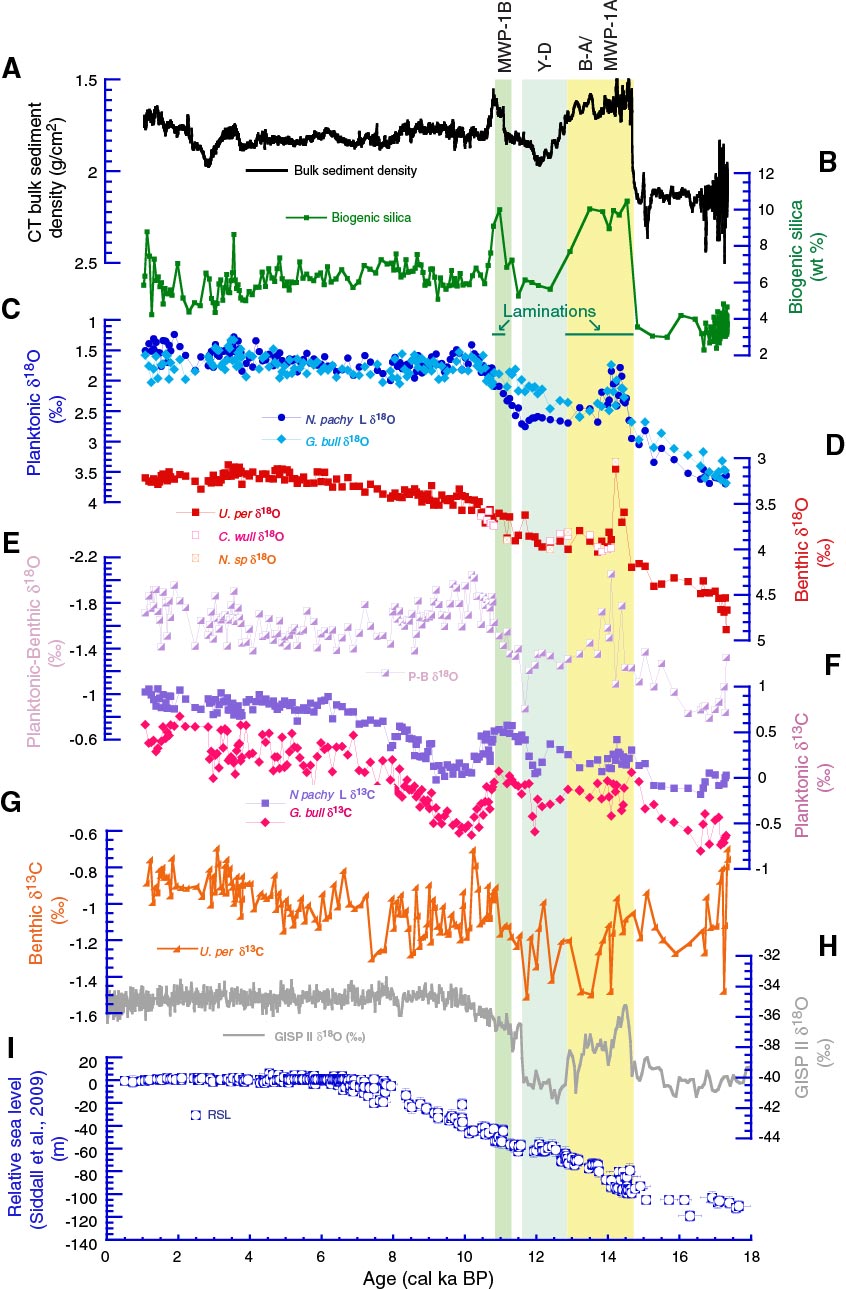
Figure F18. Lithofacies and paleoceanographic data from Core EW0408-85JC. A. Computed tomography (CT)-derived bulk density data. B. Opal (periods of lamination are delineated below the record by green bars). C. Planktonic δ18O (dark blue = Neogloboquadrina pachyderma, light blue = Globigerina bulloides). D. Benthic δ18O (solid squares = Uvigerina peregrina, open squares = Cibicidoides wuellerstorfi + 0.64, crossed squares = Nonionella sp. + 0.10). E. Planktonic-benthic δ18O (light pink squares). F. Planktonic δ13C (purple = N. pachyderma sinistral, pink-red = G. bulloides). G. Benthic δ13C (orange = U. peregrina + 0.20, orange open canted triangles = C. wuellerstorfi). For global context these data are presented next to (H) the Greenland ice core δ18O record (NGRIP; gray) (Andersen et al., 2006; Rasmussen et al., 2006; Svensson et al., 2006) and (I) the relative sea level (RSL) curve compiled in Sidall et al. (2009) (open blue squares). Timing of the North Atlantic Bølling-Allerød (B-A) and Younger Dryas (Y-D) climate anomalies is highlighted in yellow and blue, respectively, as well as meltwater pulse (MWP) 1A (yellow, coeval with the B-A), and 1B (green). From Davies et al. (2011).
Previous | Close | Next | Top of page