Previous | Close | Next
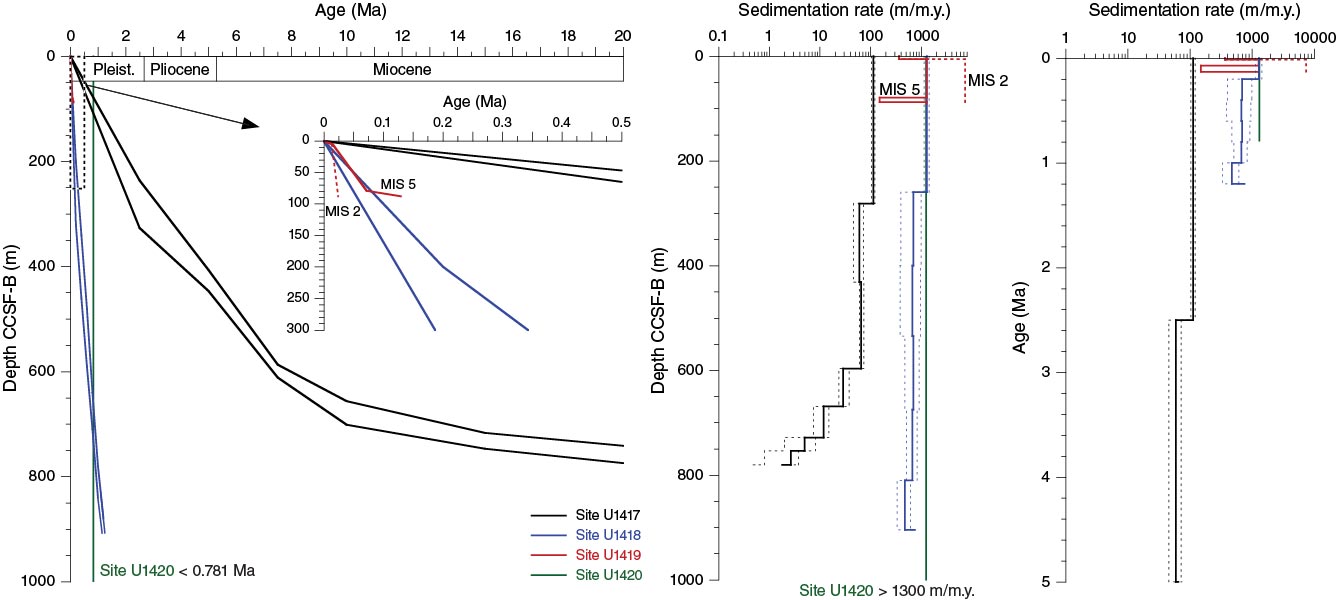
Figure F21. Expedition 341 age-depth plots and sedimentation summary. Minimum and maximum rates are shown for each site. MIS = marine isotope stage.
Previous | Close | Next | Top of page