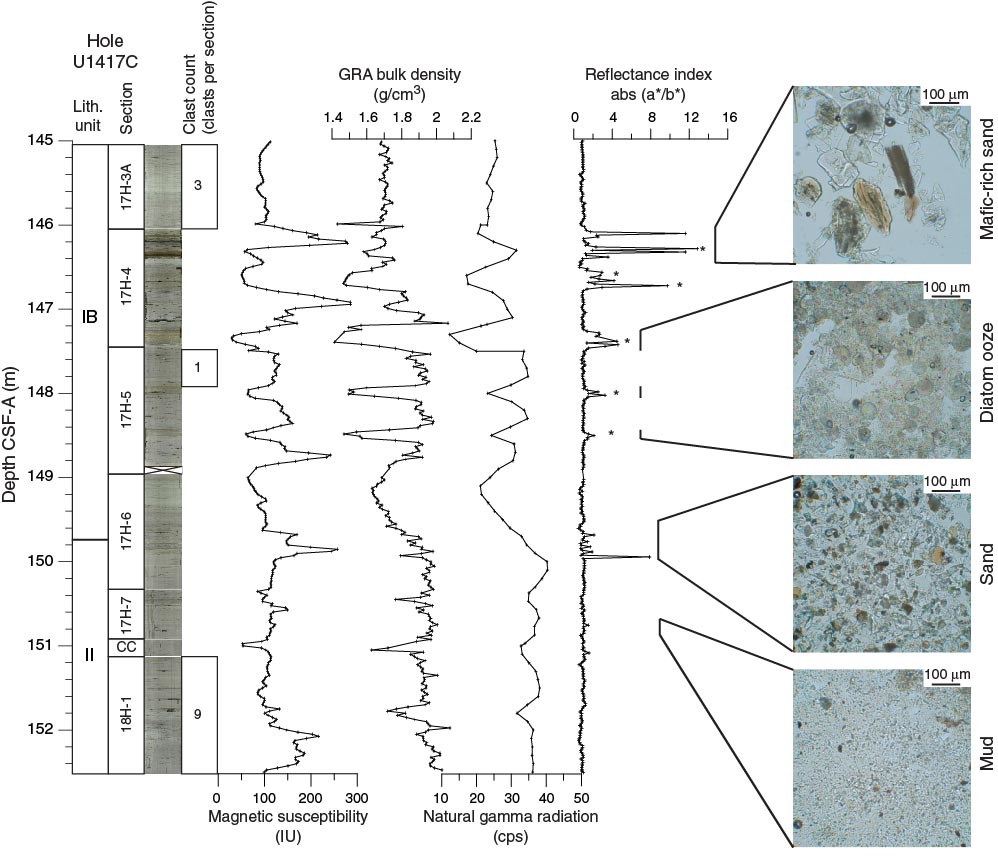
Figure F29. Diagram illustrating common relationships between lithology, clast count, and physical properties measured by the onboard core logging systems at the Subunit IB–Unit II transition (Sections 341-U1417C-17H-3A through 18H-1A). Diatom ooze is identified by decreases in magnetic susceptibility, gamma ray attenuation (GRA) bulk density, and natural gamma radiation combined with an increase in the color reflectance index. Mafic-rich sand corresponds with an increase in magnetic susceptibility, whereas volcanic ash dominated by glass shards shows no change in magnetic susceptibility. Photomicrographs of smear slides on the right illustrate the major lithologies present over specific intervals.
Previous | Close | Next | Top of page