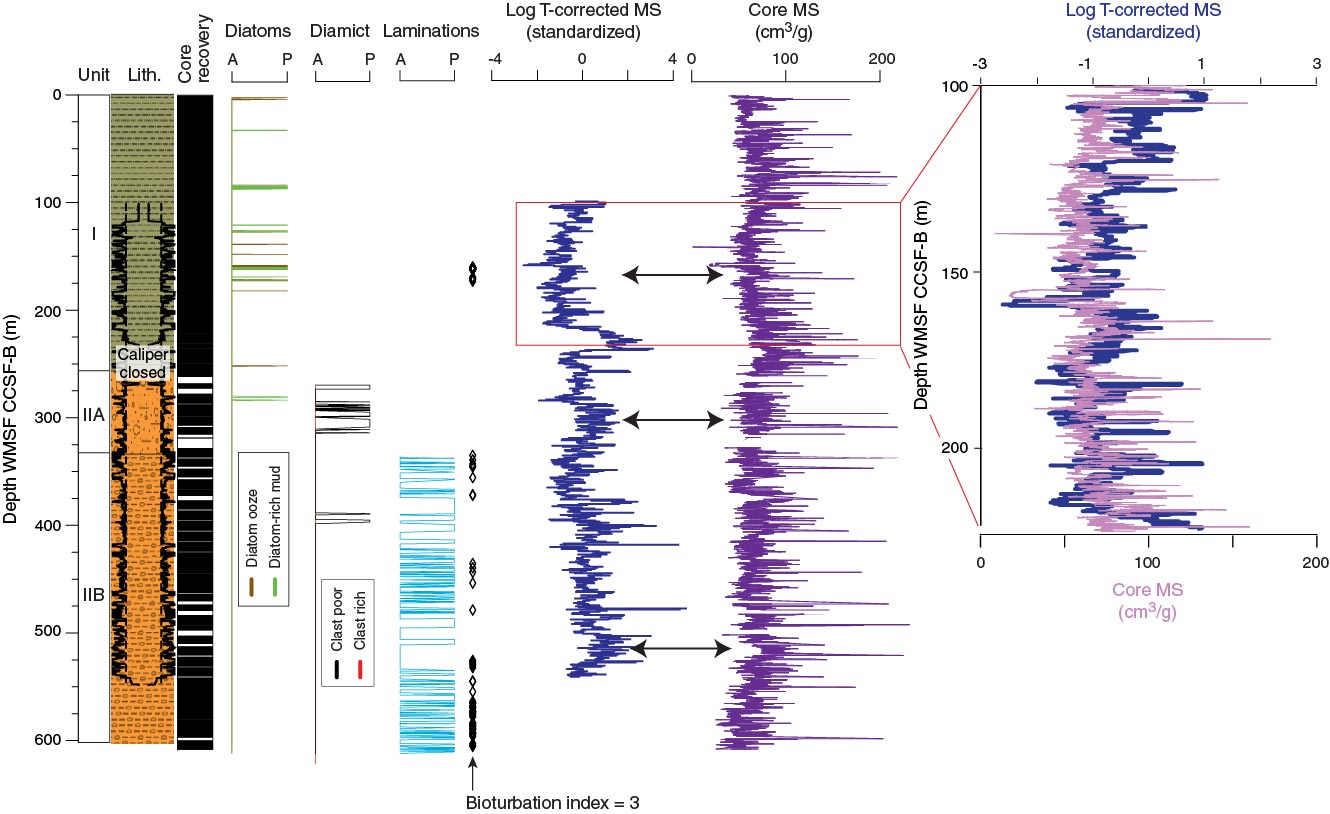
Figure F47. Lithostratigraphic units, borehole size, and core recovery, 0–600 m on the CCSF-B/WMSF scale, Site U1418. Diamict, diatom ooze, laminations, and bioturbation show the combined observations from Holes U1418A–U1418F (A = abundant, P = poor) and are compared to magnetic susceptibility (MS) data measured during downhole logging in Hole U1418F and on cores (integrated measurements made on splices). Downhole logging MS data are smoothed over a 40 cm sliding average and temperature corrected. Core MS has been smoothed over a 2.5 cm window and volumetric corrected. Inset diagram shows the close correspondence between core and logged MS between 100 and 225 m CCSF-B/WMSF.
Previous | Close | Next | Top of page